Geopaparazzi 1.1 has just been released to the Android Market.
This version now needs 1.6 (Donut) Android as minimum OS, since that is needed to support multiple screens.
Main changes:
* Italian translation
* support for multiple screens (from HTC Wildfire to Galaxy Tab)
Visit www.geopaparazzi.eu for documentation.
Release notes are here.
Wednesday, October 20, 2010
Friday, October 8, 2010
First small JGrass tools migrate to uDig
You might be thinking I am crazy, but I was waiting for this post since at least 2 years now, i.e. from the day I decided to merge JGrass into the uDig community. I never did regret the move, but I had hard times to get at least the general purpose GIS stuff of JGrass into uDig. But that last hurdle seems to be gone now.
So let me do a quick summary of what got already into the udig core (i.e. next udig releases will show them) and what will come next:
1) one of the most important one for me was having support for the GRASS format. And here it is finally.
You can now import grass locations into uDig directly and visualize/use the rasters contained.
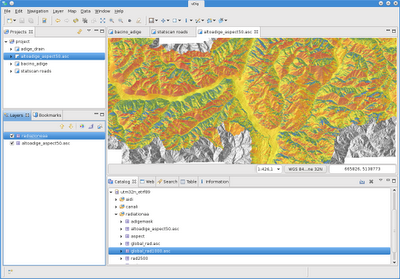
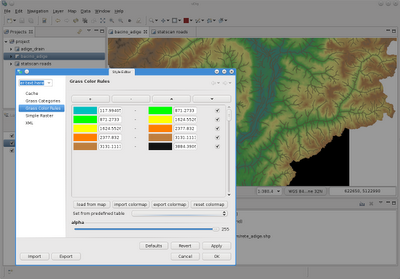
Also you can define colorrules and (!) categories.
2) The csv import tool
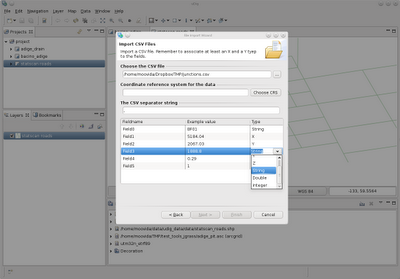
Not much to say, you have a comma separated values file that contains point coordinates, go to the import wizard, check csv import
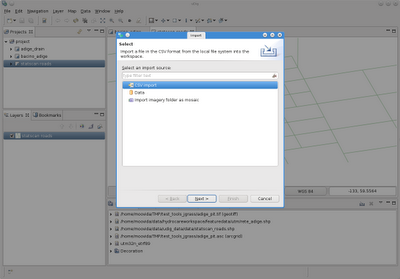
configure how you want the resulting feature layer and you are done
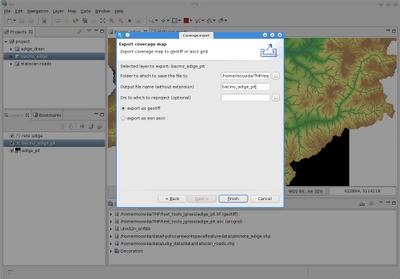
3) Coverage export
It is now possible to export coverage layers to geotiff or esrii ascii maps. Starting from the export wizard
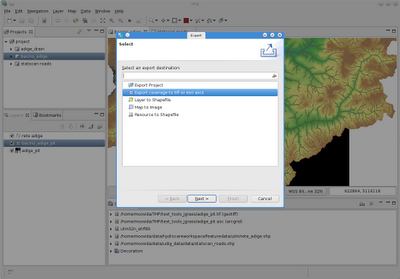
it is also possible to perform a reprojection during the export.
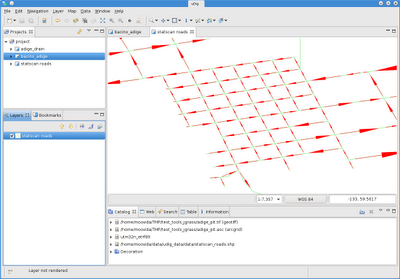
4) View line orientations
This might be of few help to some, but might be life/time saving to others. I much to often need to know the orientation of the lines that were digitalized. By selecting a line layer and opening the operations menu
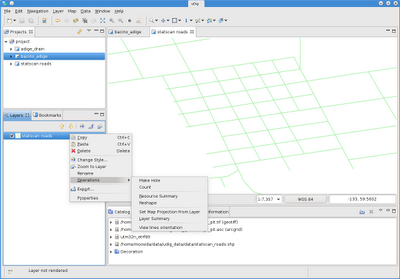
this is now shown to you through arrows
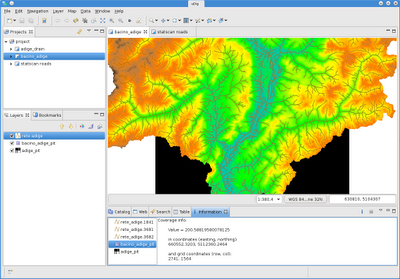
5) The coverage info tool
The info tool now also understands coverages. Therefore if you pic with the info tool over a map, now also the coverage layers are taken into account
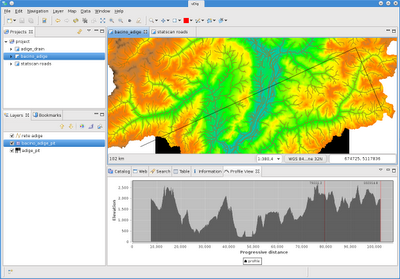
6) The profile tool
A profile tool for raster maps is now available. It is available under the info tools (the one with the red icon, indicating that there is a problem with the icon, has to be solved still)

Once activated, the selected layer's coverage is read and we can use the tool to draw lines (same as with the distance tool). The profile view opens up and the resulting profile is shown as it proceeds. Red markers are shown in the click points.
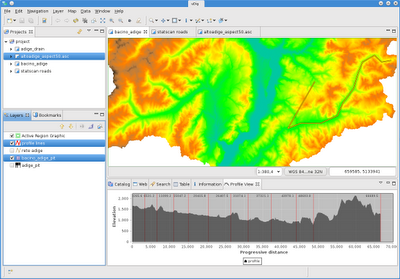
There is also a second mode to use the profile tool, which is through an existing feature.
To use that you have to select the feature layer and the raster layer you want to use for the elevations. Then you select the line feature you want to use for the profile.
From the operations menu choose: Feature on Coverage profile
You will get something like the following, having a marker in every node of the line
I feel good, I knew that I would!
Next are all the advanced style features and the netcdf format support.
So let me do a quick summary of what got already into the udig core (i.e. next udig releases will show them) and what will come next:
1) one of the most important one for me was having support for the GRASS format. And here it is finally.
You can now import grass locations into uDig directly and visualize/use the rasters contained.

Also you can define colorrules and (!) categories.

2) The csv import tool
Not much to say, you have a comma separated values file that contains point coordinates, go to the import wizard, check csv import

configure how you want the resulting feature layer and you are done

3) Coverage export
It is now possible to export coverage layers to geotiff or esrii ascii maps. Starting from the export wizard

it is also possible to perform a reprojection during the export.

4) View line orientations
This might be of few help to some, but might be life/time saving to others. I much to often need to know the orientation of the lines that were digitalized. By selecting a line layer and opening the operations menu

this is now shown to you through arrows

5) The coverage info tool
The info tool now also understands coverages. Therefore if you pic with the info tool over a map, now also the coverage layers are taken into account

6) The profile tool
A profile tool for raster maps is now available. It is available under the info tools (the one with the red icon, indicating that there is a problem with the icon, has to be solved still)

Once activated, the selected layer's coverage is read and we can use the tool to draw lines (same as with the distance tool). The profile view opens up and the resulting profile is shown as it proceeds. Red markers are shown in the click points.

There is also a second mode to use the profile tool, which is through an existing feature.
To use that you have to select the feature layer and the raster layer you want to use for the elevations. Then you select the line feature you want to use for the profile.
From the operations menu choose: Feature on Coverage profile
You will get something like the following, having a marker in every node of the line

I feel good, I knew that I would!
Next are all the advanced style features and the netcdf format support.
Subscribe to:
Posts (Atom)