# MAPSET= mapsetpath

// print out all available commands and variables
PRINTCOMMANDS

// access the current processing region attributes
echo NORTH
echo SOUTH
echo EAST
echo WEST
echo WERES
echo NSRES
echo ROWS
echo COLS

// or the region itself
echo ACTIVEREGION

// get the coordinate at a given row and col
def coordinate = coordinateFromRowCol(10, 15);
echo coordinate;

// get the nearest row and col to a given coordinate
def rowCol = rowColFromCoordinate(688605.0, 5108595.0);
echo rowCol;

/*
* reading and writing GRASS maps
*/
def grassMapName = "bacino_brenta_pit";

// get the full path of the map
def fullPath = fullMapPath (grassMapName);
echo fullPath;

// read the map
double[][] map = grassMapToMatrix (grassMapName);
// and print the output to console
printMap map

// get the average value
def avg = grassMapMax(grassMapName);
echo avg
// the same can be done for grassMapMin ,grassMapAvg, grassMapModa

// get the value of a grass raster map at a given coordinate
def value = valueOfGrassMapInCoordinate(grassMapName, 688605.0, 5108595.0);
echo value;

// write the matrix read before to a map named aaa
def grassMapToWrite = "aaa";
matrixToGrassMap (grassMapToWrite, map, -9999.0);

// delete the map from disk
deleteGrassMap grassMapToWrite;

// load a map to be viewed
loadGrassMap grassMapName;


/*
* working with vector layers and shapefiles
*/
// get the list of features from a layer
// that is loaded in the current active map
def features = getFeaturesFromLayer("countries");
features.each{ feature ->
// some features can be accessed directly on the feature,
// like area, length or the coordinates of the geometry
// as well as the centroid and the geometry itself
echo feature.area;
echo feature.length;
echo feature.coordinates[0];
echo feature.centroid;
echo feature.getAttribute("FIPS_CNTRY");
}

// the same can be done from a shapefile
def features = getFeaturesFromShapefile("D:\\data\\wb\\countries.shp");
features.each{ feature ->
echo feature.area;
echo feature.length;
echo feature.coordinates[0];
echo feature.centroid;
echo feature.getAttribute("FIPS_CNTRY");
}

// cql filters can be used from layers
def features = getFilteredFeaturesFromLayer("countries",
  "INTERSECTS(the_geom, LINESTRING (11 41, 18 41))");
features.each{ feature ->
echo feature.area;
echo feature.length;
echo feature.coordinates[0];
echo feature.centroid;
echo feature.getAttribute("FIPS_CNTRY");
}

// or again from shapefiles
def features = getFilteredFeaturesFromShapefile("D:\\dat\\wb\\countries.shp",
"LONG_NAME == 'Russia'");
features.each{ feature ->
echo feature.area;
echo feature.length;
echo feature.coordinates[0];
echo feature.centroid;
echo feature.getAttribute("FIPS_CNTRY");
}

// statistics can be calculated on fields of the features
// average of the field SQKM
def avg = featuresLayerAvg("countries", "SQKM");
echo avg;
avg = shapefileAvg("D:\\data\\wb\\countries.shp", "SQKM");
echo avg;

// min of the field SQKM
def min = featuresLayerMin("countries", "SQKM");
echo min;
min = shapefileMin("D:\\data\\wb\\countries.shp", "SQKM");
echo min;

// max of the field SQKM
def max = featuresLayerMax("countries", "SQKM");
echo max;
max = shapefileMax("D:\\data\\wb\\countries.shp", "SQKM");
echo max;

// moda of the field SQKM
def moda = shapefileModa("D:\\data\\wb\\countries.shp", "SQKM");
echo moda;
moda = featuresLayerModa("countries", "SQKM");
echo moda;


/*
* DATABASE COMMANDS (assuming table has two fields: id, name)
*/
// define the database connection
# REMOTEDBURL = postgresql:192.168.1.102:5432:dbname:user:passwd

// the table name
def table = 'schema.tablename';

// get the dataset and browse over it
def ds = dataset( table );
ds.each{
// "name" is a db table field name and can be
// used as variable to access the needed value
echo it.id + "  " + it.name;
}

// another way is to use select statements
def rows = select ("* from " + table);
rows.each{ row ->
echo row.id + "  " + row.name
}

// which can contain also the where clause
def rows1 = select ("* from " + table + " where name = 'coudiness'");
rows1.each{ row ->
echo row.id + "  " + row.name;
}

// for counting rows there is
def num = count(table);
echo num;
// on which the where clause also works
def num1 = count( table + " where name = 'coudiness'");
echo num1;

// for eveything else the database instance can be accessed
// and any query can be executed
DB.eachRow("select * from " + table){
echo it.id + "  " + it.name;
}


/*
* data import and export
*/
// import an esri ascii grid to grass raster map
importEsriAscii("C:\\TMP\\brenta2.asc", "testascii");

// import a tiff to grass raster map
importTiff("C:\\TMP\\brenta2.tif", "testtiff");

// import grass raster map to an esri ascii grid
exportEsriAscii("bacino_brenta_pit", "C:\\TMP\\brenta2");

// import grass raster map to a tiff
exportTiff("bacino_brenta_pit", "C:\\TMP\\brenta2");

/*
* the mapcalculator
*/
mapcalc {
result "mapcalctest"
function """
 if ("bacino_brenta_pit" > 1200,
    1.0,
    "bacino_brenta_pit" / 2.0)
"""
}
Sunday, January 31, 2010
new console language extentions arriving
Not much to say...
Tuesday, January 26, 2010
Netcdf in JGrass, the non spatial part
JGrass at some point got integrated with the geotools library to read netcdf files both for visualization and for analysis purposes. The geotools library is a spatial library and therefore it gives the possibility to extract multi-time and multi-depth rastermaps from local file or remote opendap. We have seen that and it looks like this:

Well, very soon we will have also a way to view the other datasets contained in a netcdf.
The rightclick now brings up a new menu Open Netcdf Viewer on this dataset:

which opens the Netcdf Viewer. The viewer has on its left a list of all the variables contained in the netcdf and that are non raster maps (grids). The variables are marked as:

In the case of 0D variables, the variable definition is dumped.

In the case of 1D variables, it is already possible to chart the variable against its dimension (axis).

In the case of 2D variables, again, the content can be charted. In the case the X axis contains time values, the proper time label is computed (those who know netcdf know what that means).

It is possible to zoom into the charts and check the values.

The viewer currently supports up to 3 dimensions. In the upper combo boxes it is possible to switch the axes in the case of 2 or 3 dimensions available.

There is also a filter box available for easier browsing of many variables.

Enjoy.

Well, very soon we will have also a way to view the other datasets contained in a netcdf.
The rightclick now brings up a new menu Open Netcdf Viewer on this dataset:

which opens the Netcdf Viewer. The viewer has on its left a list of all the variables contained in the netcdf and that are non raster maps (grids). The variables are marked as:
- G: global attributes
- 0: 0 dimensional variables (scalars)
- 1: 1 dimensional variables
- 2: 2 dimensional variables
- 3: 3 dimensional variables

In the case of 0D variables, the variable definition is dumped.

In the case of 1D variables, it is already possible to chart the variable against its dimension (axis).

In the case of 2D variables, again, the content can be charted. In the case the X axis contains time values, the proper time label is computed (those who know netcdf know what that means).

It is possible to zoom into the charts and check the values.

The viewer currently supports up to 3 dimensions. In the upper combo boxes it is possible to switch the axes in the case of 2 or 3 dimensions available.

There is also a filter box available for easier browsing of many variables.

Enjoy.
Saturday, January 23, 2010
sld for rasters in a netcdf?
From today on uDig loads sld files also for raster data. This is great and a couple of posts ago I also described the style editor that can be used to create nice raster maps.
I am currently working on netcdf data, which have a cool structure that allowes to have several rasters inside a file. What can be done in that case?
Well the sld structure can contain several styles, so it is quite easy to create a style for every resource.
For example the following sld file:
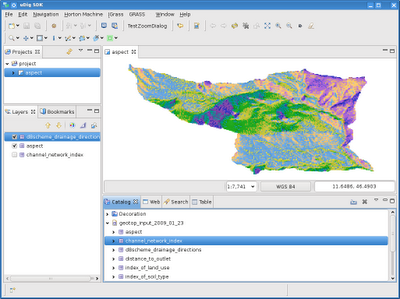
gives me the possibility to load from sld file automatically the styles for the layers aspect, d8scheme_drainage_direction and surface_altitude.
The not so friendly thing is that for now to have multiple styles inside the sld file, you have to paste them from the raster style editor. But once done you are fine.
I am currently working on netcdf data, which have a cool structure that allowes to have several rasters inside a file. What can be done in that case?
Well the sld structure can contain several styles, so it is quite easy to create a style for every resource.
For example the following sld file:
<?xml version="1.0" encoding="UTF-8"?>
<sld:StyledLayerDescriptor xmlns="http://www.opengis.net/sld" xmlns:sld="http://www.opengis.net/sld" xmlns:ogc="http://www.opengis.net/ogc" xmlns:gml="http://www.opengis.net/gml" version="1.0.0">
   <sld:UserLayer>
       <sld:LayerFeatureConstraints>
           <sld:FeatureTypeConstraint/>
       </sld:LayerFeatureConstraints>
       <sld:UserStyle>
           <sld:Name>aspect</sld:Name>
           <sld:Title/>
           <sld:FeatureTypeStyle>
               <sld:Name>aspect</sld:Name>
               <sld:FeatureTypeName>Feature</sld:FeatureTypeName>
               <sld:SemanticTypeIdentifier>SemanticType[ANY]</sld:SemanticTypeIdentifier>
               <sld:Rule>
                   <sld:RasterSymbolizer>
                       <sld:Geometry>
                           <ogc:PropertyName>raster</ogc:PropertyName>
                       </sld:Geometry>
                       <sld:Opacity>
                           <ogc:Literal>1.0</ogc:Literal>
                       </sld:Opacity>
                       <sld:OverlapBehavior>
                           <sld:RANDOM/>
                       </sld:OverlapBehavior>
                       <sld:ColorMap type="ramp">
                           <sld:ColorMapEntry color="#000000" opacity="1.0" quantity="0.0"/>
                           <sld:ColorMapEntry color="#FFFFFF" opacity="1.0" quantity="180.0"/>
                           <sld:ColorMapEntry color="#FFFFFF" opacity="1.0" quantity="180.0"/>
                           <sld:ColorMapEntry color="#000000" opacity="1.0" quantity="360.0"/>
                       </sld:ColorMap>
                       <sld:ContrastEnhancement/>
                       <sld:ShadedRelief>
                           <sld:BrightnessOnly>false</sld:BrightnessOnly>
                           <sld:ReliefFactor>55</sld:ReliefFactor>
                       </sld:ShadedRelief>
                   </sld:RasterSymbolizer>
               </sld:Rule>
           </sld:FeatureTypeStyle>
       </sld:UserStyle>
       <sld:UserStyle>
           <sld:Name>surface_altitude</sld:Name>
           <sld:Title/>
           <sld:FeatureTypeStyle>
               <sld:Name>name</sld:Name>
               <sld:FeatureTypeName>Feature</sld:FeatureTypeName>
               <sld:SemanticTypeIdentifier>SemanticType[ANY]</sld:SemanticTypeIdentifier>
               <sld:Rule>
                   <sld:RasterSymbolizer>
                       <sld:Geometry>
                           <ogc:PropertyName>raster</ogc:PropertyName>
                       </sld:Geometry>
                       <sld:Opacity>
                           <ogc:Literal>1.0</ogc:Literal>
                       </sld:Opacity>
                       <sld:OverlapBehavior>
                           <sld:RANDOM/>
                       </sld:OverlapBehavior>
                       <sld:ColorMap type="ramp">
                           <sld:ColorMapEntry color="#00BFBF" opacity="1.0" quantity="2012.86"/>
                           <sld:ColorMapEntry color="#00FF00" opacity="1.0" quantity="2096.901999816894"/>
                           <sld:ColorMapEntry color="#00FF00" opacity="1.0" quantity="2096.901999816894"/>
                           <sld:ColorMapEntry color="#FFFF00" opacity="1.0" quantity="2180.9439996337887"/>
                           <sld:ColorMapEntry color="#FFFF00" opacity="1.0" quantity="2180.9439996337887"/>
                           <sld:ColorMapEntry color="#FF7F00" opacity="1.0" quantity="2264.986007080078"/>
                           <sld:ColorMapEntry color="#FF7F00" opacity="1.0" quantity="2264.986007080078"/>
                           <sld:ColorMapEntry color="#BF7F3F" opacity="1.0" quantity="2349.027999267578"/>
                           <sld:ColorMapEntry color="#BF7F3F" opacity="1.0" quantity="2349.027999267578"/>
                           <sld:ColorMapEntry color="#141514" opacity="1.0" quantity="2433.069991455078"/>
                       </sld:ColorMap>
                       <sld:ContrastEnhancement/>
                       <sld:ShadedRelief>
                           <sld:BrightnessOnly>false</sld:BrightnessOnly>
                       </sld:ShadedRelief>
                   </sld:RasterSymbolizer>
               </sld:Rule>
           </sld:FeatureTypeStyle>
       </sld:UserStyle>
       <sld:UserStyle>
           <sld:Name>d8scheme_drainage_directions</sld:Name>
           <sld:Title/>
           <sld:FeatureTypeStyle>
               <sld:Name>name</sld:Name>
               <sld:FeatureTypeName>Feature</sld:FeatureTypeName>
               <sld:SemanticTypeIdentifier>SemanticType[ANY]</sld:SemanticTypeIdentifier>
               <sld:Rule>
                   <sld:RasterSymbolizer>
                       <sld:Geometry>
                           <ogc:PropertyName>raster</ogc:PropertyName>
                       </sld:Geometry>
                       <sld:Opacity>
                           <ogc:Literal>1.0</ogc:Literal>
                       </sld:Opacity>
                       <sld:OverlapBehavior>
                           <sld:RANDOM/>
                       </sld:OverlapBehavior>
                       <sld:ColorMap type="ramp">
                           <sld:ColorMapEntry color="#FFFF00" opacity="1.0" quantity="1.0"/>
                           <sld:ColorMapEntry color="#FFFF00" opacity="1.0" quantity="1.0"/>
                           <sld:ColorMapEntry color="#00FF00" opacity="1.0" quantity="2.0"/>
                           <sld:ColorMapEntry color="#00FF00" opacity="1.0" quantity="2.0"/>
                           <sld:ColorMapEntry color="#00FFFF" opacity="1.0" quantity="3.0"/>
                           <sld:ColorMapEntry color="#00FFFF" opacity="1.0" quantity="3.0"/>
                           <sld:ColorMapEntry color="#FF00FF" opacity="1.0" quantity="4.0"/>
                           <sld:ColorMapEntry color="#FF00FF" opacity="1.0" quantity="4.0"/>
                           <sld:ColorMapEntry color="#0000FF" opacity="1.0" quantity="5.0"/>
                           <sld:ColorMapEntry color="#0000FF" opacity="1.0" quantity="5.0"/>
                           <sld:ColorMapEntry color="#A020F0" opacity="1.0" quantity="6.0"/>
                           <sld:ColorMapEntry color="#A020F0" opacity="1.0" quantity="6.0"/>
                           <sld:ColorMapEntry color="#FFA500" opacity="1.0" quantity="7.0"/>
                           <sld:ColorMapEntry color="#FFA500" opacity="1.0" quantity="7.0"/>
                           <sld:ColorMapEntry color="#1E90FF" opacity="1.0" quantity="8.0"/>
                           <sld:ColorMapEntry color="#1E90FF" opacity="1.0" quantity="8.0"/>
                           <sld:ColorMapEntry color="#FF0000" opacity="1.0" quantity="10.0"/>
                           <sld:ColorMapEntry color="#FF0000" opacity="1.0" quantity="10.0"/>
                       </sld:ColorMap>
                       <sld:ContrastEnhancement/>
                       <sld:ShadedRelief>
                           <sld:BrightnessOnly>false</sld:BrightnessOnly>
                           <sld:ReliefFactor>55</sld:ReliefFactor>
                       </sld:ShadedRelief>
                   </sld:RasterSymbolizer>
               </sld:Rule>
           </sld:FeatureTypeStyle>
       </sld:UserStyle>
   </sld:UserLayer>
</sld:StyledLayerDescriptor>
gives me the possibility to load from sld file automatically the styles for the layers aspect, d8scheme_drainage_direction and surface_altitude.

The not so friendly thing is that for now to have multiple styles inside the sld file, you have to paste them from the raster style editor. But once done you are fine.
Wednesday, January 20, 2010
maven-ant-task and the misleading errors
Today I ran the refresh.xml from the udig libs plugin again to get back in sync with the current development. And I got an error about some ant task that can't be executed... ugh, it is not the first time.... wont be the last. Since my mind does not want to remember and this fools me every time, this time I document it. :)
What happens is that to execute ant tasks, the maven-ant-tasks package is used, which the uDig community holds inside the code trunk in:
trunk/extras/org.apache.maven-ant-tasks/lib
So we are usually fine, the only thing is that from time to time, the jar: maven-ant-tasks-2.1.0.jar, currently at version 2.1.0 is updated and eclipse doesn't know were to find it any more.
Well, here is how to set it: preferences-> ant -> runtime

simply check that your path is set to a jar that really exists. If not, remove and add the existing jar (add external jar).
Subscribe to:
Posts (Atom)