Showing posts with label jgrasstools. Show all posts

Wednesday, January 6, 2021

Hortonmachine 0.10.0 released - get a grip on your basins size

It sure is a while that I don't post about the Hortonmachine. While we work a lot on it and with it, it always kind of stays in background. Well today we decided to make a new release due to some tools that will be used in production environments. And I think one is definitely worth to mention.

Some of you might have used the netnumbering module to extract subbasins on a network. The module also accepts monitoring points to allow splitting the basin in fixed points. 

For a watershed like this:

The result is something like:

Now, some models, as for example Riccardo Rigon's Geoframe, need a bit more control over the basin's size. This is why, on Riccardo's request, we added the possibility to set a desired output basins size and  buffer threshold, to handle some degree of flexibility.

It has been quite some fun and recursive exercise to aggregate in the best possible way basins that are too small. We added plantuml mindmap outputs to be able to better check the way the hierarchy is getting merged. This has been really helpful, in particular to check large basins and also to check on monitoring point positions, which is where basins are meant to keep a fixed border.

 Here the mindmap of the above basin, with references to areas and fixed basins:


and finally the aggregated basins mindmap assuming a desired basin size of 100000 cells (10*10 meters here) and a 20% of threshold:


and the resulting subbasins map:

The result is quite nifty, given the fact that the only basins that do not obey to the 20% buffer are either basins that are fixed and at the very top (so they can't be merged with anyone) or basin 6 which is "blocked" between 2 fixed basins, so same as before, no way to enlarge it by aggregation.

Well, you can find a release containing the tools at the usual release download site of the Hortonmachine here.

Enjoy! We surely did :-)


Thursday, October 5, 2017

JGrasstools back in black: The Horton Machine - Part 1

I have to admit that when in far 2002, working at the University of Trento, Faculty of Environmental Engineering, we published the first release of The Horton Machine, I never thought we would ever change that name. The Horton Machine was a collection of around 40 GRASS modules written in C and dedicated to advanced Hydrology and Geomorphology. They represented the effort of the passed 10 years (now around 20) of professor Riccardo Rigon and his team.

At that time Riccardo and I were dreaming about a nice to use GUI for GRASS that would allow GRASS to be used more outside of the academic domain. In 2003 we started the JGrass project with that objective: create a userfriendly GUI for GRASS. The reaction of the GRASS community was bad, mostly (so they said) because Java was not open source. Also QGis was coming and becoming the natural choice for being an interface to GRASS.

Not at all in the mood of religious wars in 2006 we decided to join the java tribe and moved our resources to support the uDig project, where we happily lived and developed for many many years. We kind of stayed between two worlds, still using GRASS and its mapsets, but living in the userfriendly java world. :-)

At that time the processing libraries for Hydrology and Geomorphology (as well as LiDAR and forestry later on) were extracted into a library that could be used in standalone mode or inside uDig. That library, as a logical follow-up, got the name JGrasstools.

Had I only known better! In some (rare, but still!) occasions I and other JGrasstools developers have been asked why we still use the name JGrasstools, since we are not directly "bound" to GRASS. Well, I have been fighting over this a few times and had no hard feeling about this, apart of the huge work that it would have been to change everything. 

The last time it happened, was at the Foss4g conference in Paris. At the end of a great presentation given by Silvia about the tools we developed for forestry management using LiDAR data, (again) a member of the GRASS community asked the same old question in the questions interval dedicated to the presentation: Why do you still call it JGrasstools....?

This was the final straw for me. I still have to understand why people do certain things, but one thing was sure for me: we had to change that name, to make some of the GRASS community members sleep sweet dreams, and to be finally free!

So this is it. After 15 years of continuous development on the JGrasstools core, we go back to our origins: The Horton Machine.

The Horton Machine is now something more than just Hydrology and Geomorphology, there are other projects that support interaction with the mobile digital field mapping app Geopaparazzi, a module that supports interaction with spatial databases (also on android), the LESTO modules developed with the team of professor Giustino Tonon at the Free University of Bolzano... and beyond other things... also the plugins for the Desktop GIS gvSIG.

It has been quite an exercise to make this namespace migration and has taken me days between code refactoring, domain registration, maven publishing updates, documentation updating (still much work to be done there) and and and... but it is done now. Many will sleep sweet dreams, and I will be the first. And maybe at the next conference someone will ask a question related to the content of the presentation. Don't know what? A hint: "How did you get such a high single tree extraction rate from LiDAR data with your tools?" ;-)
 

 What will happen now?

Before the 13 international gvSIG conference we will do the first HortonMachine branded release and the together with it the connected release if gvSIG plugins.

Also maven releases of the modules will be done. At the time JGrasstools was at version 0.8.1. The HortonMachine will most probably start at 0.9.0. It sure should have been a major number, but well, we still need to reach the first major. :-)

In the next post we will show you what you will find in the release. Stay tuned!


Wednesday, June 21, 2017

Geopaparazzi 5.4.0 is out

We just released Geopaparazzi 5.4.0 into the wild!

It all started with a bug fix to have a 5.3.2 that would be able to read the latest mapsforge maps. For some unknown reason the backward compatibility had been lost and geopaparazzi was no longer able to visualize newer mapsforge maps. Being the most important map used, that had to be fixed.

Then we noticed that also GPS import was broken. In fact the new plugin system had a bug. That also had to be fixed.

Then we fixed some smaller usability issues that had been reported, but this also was ok for a 5.3.2 bugfix release.

What made us decide to go for a 5.4.0, was a fantastic project we are doing with other members of the gvSIG Association for INEGI. INEGI is the National Institute of Statistics and Geography of Mexico and recently we won a tender to supply a whole GIS stack for Desktop-Server-Mobile.

At HydroloGIS we are obviously taking care of the mobile part and it is thrilling to know that INEGI invested in Geopaparazzi/gvSIG Mobile and that hundreds of technicians will use it to do their digital field surveys.

That project already brought in the previous release an important change which is the plugin system.

Recently it also added to geopaparazzi two important features:

1) support for unique values map theming in spatialite databases

Geopaparazzi now supports in readonly mode unique value styled spatialite layers.

We are used to a simple style in geopaparazzi:


Now you can do things like these...

Polygons:


Lines:


Points:


Looks quite nifty :-)

But now the problem... how do we make such a styled database?

We created a tool inside the JGrasstools Spatialtoobox, which means it will also get to gvSIG. Right now there are compatibility issues between the spatialite drivers of JGrasstools and gvSIG. We will probably get there for the 2.4.0 release.

In the meanwhile people interested can pick the standalone version of the JGrasstools' Spatialtoolbox, which can be downloaded here.

Just run the script jgt-spatialtoolbox.sh and look for the right module:


Now pay attention. This will import a folder of shapefiles into a newly created (or existing) spatialite database. If the shapefile has a style defined in an SLD file, then that will be used. So use your favorite SLD editor and create a unique values theme, and it will be inserted in the new database, geopaparazzi ready!

2) pdf export

The second interesting feature is the PDF export of form based notes.

For those users that couldn't care less of GIS and complex stuff, but only want to have a nice ordered list of the surveyed data, the PROJECT FORMS TO PDF button is the right choice:


This will export the content of the form based notes to PDF, trying to group the information nicely into tables, adding any image contained in the note.
Just to have an idea, this is how 2 random pages would look like:


That's it, huge thanks to INEGI for pushing this project and making geopaparazzi better!!


Thursday, March 2, 2017

First release of the JGrasstools and Geopaparazzi plugins for gvSIG


Ther are finally here. We were able to finalize, test and package the JGrasstools and Geopaparazzi plugins for gvSIG and make a first official release out of them.

It is a first shy 0.1.0, but it contains tons of functionalities ready to be tested by the community.


To download and install the plugins, please have a quick look at this document.

Not much more to say, everything is in the linked quickstart guide... enjoy!


Monday, June 13, 2016

Extrusion for the 3D vector view in gvSIG

As some of you might know already, some time ago we started to migrate all our tools (JGrasstools and Geopaparazzi, as well as the Nettools) to gvSIG. We are quite young in this community and we joined as an official member the gvSIG Association only at the begin of this year.

In the meanwhile we brought geopaparazzi support, the JGrasstools based Spatial Toolbox and the Epanet part of the Nettools into gvSIG.

Recently we were involved by one of the other association members, the Spanish Company DISIS, to develop with them the extrusion part for the 3D vector viewer integrated in gvSIG.

I am really thrilled by this cooperation, which brings us one more step towards the core of the community and also shows that there is movement in the gvSIG related Open Source Market.

A few notes about the extrusion plugin

From the version 2.3 of gvSIG on (well, right now the official release is not yet out), a 3d is available which allows the user to visualize layers in a Nasa World Wind 3d view. The user can select several loading modes for the layers.

The 3d properties of a vector layer can be accessed by right clicking on the layer and accessing the Properties entry in the context menu. By default the 3D tab will show up like this:


At the current time there are 3 different loading modes for vector layers:
  1. Rasterized vector: the gvSIG vector layer will be rasterized as an image over the 3d view
  2. Vector: the features from the gvSIG vector layer will be transformed into 3d vectors and loaded in the 3d view
  3. Extruded Vector: the features from the gvSIG vector layer will be transformed into 3d vectors and loaded in the 3d view, with an applied extrusion, in order to obtain an effect of volume.
Since I have been working on the last two modes, I will give a quick insight on those.

Vector

The Vector loading mode presents the following user interface:


The altitude of the features can be defined by two factors (and also be the sum of both):

  1. the 3rd dimension of the geometry, if available (3d shapefiles for example)
  2. the Constant Height parameter

There are 3 available elevation modes, which will consider the altitude differently:
  • clamp to ground: in this case the features are clamped to the elevation model currently used in the 3d view. In this case the altitude definition will not be considered.
  • absolute: in this case the elevation of the vector is given by the altitude, defined as absolute elevation over the sea level.
  • relative to ground: in this case the elevation of the vector is given by the altitude, defined as relative elevation over the terrain.

For example this is how the clamp to ground option would look like:


We can see that the very coarse default terrain model in many parts covers the vectors. In this case it is possible to set the mode to relative to ground and apply a constant height to solve it:


Extruded Vector

The extruded vector loading mode adds a couple of parameters to the user interface:
 

In this case the altitude of the features can be defined by four factors:
  1. the 3rd dimension of the geometry, if available (3d shapefiles for example)
  2. a Height Field from the attributes table
  3. the Constant Height parameter
  4. the Vertical Exaggeration, which is a multiplication factor applied to the height

There are 2 available elevation modes, which will consider the altitude differently:
  • absolute: in this case the elevation of the vector is given by the altitude, defined as absolute elevation over the sea level.
  • relative to ground: in this case the elevation of the vector is given by the altitude, defined as relative elevation over the terrain.
For example, if we select the relative to ground option and apply an height field that contains the building heights, this will look like:


Again we can apply a constant height to elevate the features over the terrain. Let's also try to use the number of the floors of the buildings instead of the altitude. In this cas we can apply a vertical exaggeration of 3 meters to simulate the correct building altitude:


Other examples

Example of a lines layer of isolines that have 3d coordinates. Here the extruded mode was selected and the absolute elevation mode was picked adding also a constant height of 50 additional meters:


The same layer and parameters, but without extrusion:


An example of points layer that do not have 3rd coordinates, but an absolute elevation in the attributes table. In this case the extrusion was picked and the absolute height taken from the elevation field in the attributes table:


Since the elevation is the one of the terrain, it is not possible to appreciate the extrusion effect. By adding a constant height to add as an offset, this is solved:


There is also a short video that shows 3D extrusion in gvSIG live here.

Acknowledgements


It has been great fun to implement this and also helped me know a new piece of the gvSIG internals, which is quite important right now.

So thanks to DISID for this, since our involvement in gvSIG they have always been very supportive to involve us and teach us to get up and running as fast as possible.


Monday, December 7, 2015

The 11th international gvSIG conference


It has all in all been a good conference, even if it was our first gvSIG conference since the migration from uDig to gvSIG. 
 
The community gave us a warm welcome and apart of all the presentations, we also spent a lot of time developing together at the code sprint, working on integrating gvSIG in OSGeo 4 Windows, chatting about gvSIG for water management... and obviously having great fun :-)


For those interested, here the slides of the presentations we gave:

1) Digital field mapping with Geopaparazzi and gvSIG

http://www.slideshare.net/moovida/digital-field-mapping-with-geopaparazzi-and-gvsig

2) New tools for LiDAR, forestry, river management and hydrogeomorphology in gvSIG

http://www.slideshare.net/moovida/new-tools-for-lidar-forestry-river-management-and-hydrogeomorphology-in-gvsig

3) GIS tools for water supply systems: an implementation using JGrasstools and gvSIG

http://www.slideshare.net/silli/epanet-in-gvsig


Sunday, November 22, 2015

Bye bye uDig, hello gvSIG world!

Bye bye uDig


This post should have been written ages ago. But I have never been ready to do so. And it still is very difficult for me to properly write something about my exit from the uDig community. The Open Source ecosystem is a particular one and people not involved in the same way understand things differently. But I love the Open Source ecosystem, it gives you always a new possibility even if it might seems there is none.

So I will try to stick with the facts, even if being my personal blog some passion could seep through.

We have loved uDig for many years. We have contributed about everything that means raster analysis in uDig and have been in the Project Steering Committee for several years. We fought the trend that was keeping uDig "only" an SDK for developers instead of a desktop GIS for the community. And well, it is time to say that we failed.

My guess is that uDig will never be a widely used desktop GIS, i.e. a standalone GIS. uDig will always be an amazing SDK. Something you use to build great location aware applications.

uDig has always suffered from the fact that there were almost no contributions in the last 5 years. No resources/interest to the fix bugs that were stopping people from using it. uDig didn't evolve much. Resources were really low and at some point I remember always the same 3 developers trying to get uDig up and running, adding stuff, making it work: Jody, Frank and myself.

Then, in this low resources situation we made a huge error. We started the migration into the Locationtech Fundation. Which is not an error per se, but in the conditions the community of developers was in, that has been an irresponsible move. uDig entered a kind of limbo from which I think it still didn't exit. There was no real well working version available and all resources were in the migration process. A process that lasted about 2 years. In the meanwhile we lost possible contributions (at least one big I know of), since it was not clear were to contribute: the old was old, the new was never finished.

In the middle of all this mess, in which Jody and Frank were doing a big big voluntary work and keeping the uDig ecosystem on their shoulders alone (kudos for all that to you guys), I started to retire from uDig. Several long discussions at the Nottingham Foss4G opened my eyes an made me understand that I was in the wrong project.
uDig was on the way to be an only-SDK project (if you disagree with that i will be happy to openly discuss about it) and this was no longer something I would be part of.
Also, the Locationtech environment was not exactly what I expected it to be (I am not saying good or bad, I am just saying not the right thing for me).

So we left... without knowing where to go. For a couple of years we were working without a desktop GIS. Something that had never happened before... and it felt really wrong!

But our clients needed our tools, so we created the standalone version of the spatial toolbox, S.T.A.G.E.
Funny thing is that once the tool was standalone, also QGIS users approached us, because it was handy. They didn't like it in uDig, but if they could use it with QGIS it was ok :-)

Hello gvSIG world!


Well, time passed and it was still unclear to us were we would land. uDig was still blocked somewhere in the migration process... when a company of friends of ours invited us to come to the gvSIG conference in 2014, offering to pay travel and accommodation. They were interested to see our Geopaparazzi digital field mapping tools inside gvSIG to use them in projects in development countries. While I was still emotionally too bound to uDIG to cheat on it, Silvia was very sensitive to the words "development countries", so we decided to accept the offer.

We had a private meeting with the gvSIG Association members and developers to discuss the possibilities to work together and migrate our JGrasstools and Geopaparazzi libraries into gvSIG.
I have to admit they were extremely helpful and we also made a session to quickly get me up and running with gvSIG development.

After the conference we came back to reality... with no funding we could never migrate... the process was simply too big. So time passed and nothing happened. Secretly I hoped the uDig migration nightmare would be over and we could go back to normal life.

A couple of months ago we decided to end the suffering and at least try something. So I contacted Alvaro Anguix from the gvSIG Association and discussed with him the blockers we had (mainly about the projection system) to start using gvSIG. After some discussions, we decided that it would be best for me to spend a week with them at the gvSIG headquarters in Valencia, hacking, coding and discussing the way thing should or should not be.

At the begin of this month I did exactly what that. I tried to prepare myself as much as possible in order to have tons of complex questions for their developers and flew to Valencia.

I had the luck to sit for a week near gvSIG's main architect and talk daily also to other developers, as well as discuss about user needs and features and Open Source philosophy. I found gvSIG to be a nice community, even if until that moment focused heavily on the latin world.

So let me show you what we were able to achieve in the last weeks.

I started with the aim to:
  1. bring the water management module based un Epanet into gvSIG
  2. bring support for geopaparazzi databases to gvSIG

The water management module

Porting that module has been fun. The biggest difficulty has been understanding the styling engine of gvSIG, which is way different from uDig.    

So for now we have a HydroloGIS menu inside which an Epanet menu appears. From there you can do the usual stuff: create new project files, link the layers properly together the Epanet way (filling in the attributes) and style layers:


When you run the module, the usual wizard appears. Now that wizard remembers exactly everything you entered before, which comes in handy when working a lot with simulations.


Results are stored directly into a sqlite database. One file can also contain more simulation runs.

The results can be visualized in two ways:
  1. view the state of the network in one moment (in time) on the whole map. This now looks way better than in uDig, since gvSIG allows for a nice legend to be updated. So in the layerview you will see also the values for each colored pipe or pump or junction.
  2. view the whole timeline of one of the pieces of the pipeline.


If you are interested to know more about it, come to this year's gvSIG conference, Silvia will give a talk about it:

GIS tools for water supply systems: an implementation using JGrassTools and gvSIG


Geopaparazzi support

gvSIG now has direct Geopaparazzi database support. That means that as you add any WMS, shapefile or tiff layer, now also an option for Geopaparazzi appears.


Once you select the database file, some information about the database will appear, as well as the layers it will create on loading:


You have the option to import it to temporary layer, but also to create shapefiles from the database.
The second option gives more features and is the suggested way to go.

Once imported, the layers will be generated with their own default style and labeling:


The media layer can now be queried with an own tool:


So if you select one or more images, they will be opened:


gvSIG now also has the tool to create a tileset (for Geopaparazzi basemaps) from the current view:


If you are interested in this, again, come to this year's gvSIG conference, I will be giving a talk about it. :-)

Digital field mapping with Geopaparazzi and gvSIG

The spatial toolbox: JGrasstools

Since things were going really fast (I was in Valencia and working around 15 hours a day, no partying for me this time :-) ), I decided to also give the spatial toolbox a try.

One thing that helped, was the fact that gvSIG is licensed under GPL license, which is the same one I love and JGrasstools are licensed under. That gave huge advantage during the integration.

This took a bit more work, also after the Valencia days, but it is already usable:


Obviously the layers are taken from the current selected map view and the coordinates (as in the above extract basin module) are set form clicks on the map.


If you are interested in this, again-again come to this year's gvSIG conference, I will be giving a talk about it. :-)

New tools for LiDAR, forestry, river management and hydro-geomorphology in gvSIG
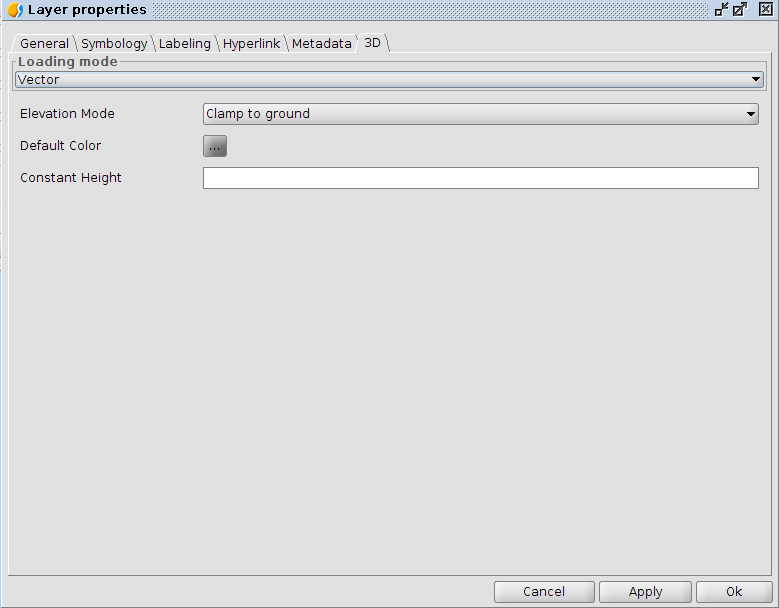
Styling rasters

I am not sure why that happens, but every time I approach a GIS first, rasters is one of the last things to be considered. :-) Also the gvSIG raster system is not the best right now, but I know that there are resources to work on it next year, so I am quite happy about it.

For now, one thing that is really necessary, is the possibility to style rasters properly.

Right now, if I define a colortable for a map, I get 255 color rules.
One good example is the map of aspect. Such a map, that ranges between 0 and 360 degrees, is usually coloured from white to black between 0 and 180, and from black to white between 180 and 360. So all you need would be 3 rules, not 255 which make everything unreadable (apart of being wrong):


If I wanted to customize them, the only way I seemed to have, was selecting and editing each rule. That got odd very quickly.

So it has been better to invest that time to create a small styling tool, which right now is hosted in the HydroloGIS menu, but I really hope it will get into the raster style engine at some point.

An example: One of my favourite base maps is the elevation model with the aspect map overlayed with transparency, which gives that 3D sensation.

Just select the colortable and the transparency. Also the number format pattern in the legend and push apply. That is it:


Some legends are just colors, which will be adapted between the min and max of the raster map. Others, like the map of flowdirections instead, have defined unique values and colours:


One thing I have not been able to, is styling a map with a logarithmic scale. I have tried but failed. That one is for example important for a map like the one of total contributing areas, where the values range from 1 (many many cells) to huge numbers (but few few cells):


well, this should look more like this:


Coordinates Info tool

To exercise myself (and because Silvia forced me to :-) ) I developed a mini-plugin that allows the user to view the clicked coordinates and see them in another projection, but most of all allows to copy them quickly to use them:


Well known text tools

A last small tool that I added is the WKT toolbox. It is a very simple tool, but we find it very useful:


With it you can select a geometry in the layer and extract the WKT representation of the geometry.

The same way, in the lower box, you can write/paste some WKT geometry and it will be inserted as new feature in the currently selected layer, if it is of the same geometry type.

This makes it very easy, for example, to insert points in a layer.


Conclusions

Well, it is strange for me to finish a blog post with a conclusions section, but this one requires it.

I love the open source ecosystem. Once again, even if with much work and some investment, we have been able to find what we needed. HydroloGIS will from now on embrace the gvSIG community and bring its tools (as well as the ones from the universities of Trento and Bolzano) into gvSIG (time and resources permitting).

We have a desktop GIS again. We have a community that focuses on a community GIS again. One that focuses on user needs and tools, on cool selection features, even cooler editing features, on a working printing system (do we want to produce maps or not!??!?!), on 3D, on linear referencing, on table joins, and... and...

Hardhearted I bid farewell to the uDig project. With a small tear in my eyes I say ciao to those great developers with which I shared many nights, code sprints and fun talks. Jody and Frank, it has been a great journey with you and I will see you at the next Foss4g. I know you will bring uDig on top again at some point even without me ;-). Good luck in your quest!  


Tuesday, February 10, 2015

HydroloGIS, 10 years of proud Italian Scientific Geographic Open Source and Environmental Engineering

I still remember it as if it was yesterday. We were sitting in the lab of Unitn (the Faculty of Evironmental Engineering of the University of Trento, where we were doing research for professor Rigon) and we were thinking about what to do. Money was running out in universities and the figure of external research staff was being obsoleted. Italy was going to face one big economical crisis.

I remember Silvia saying that she wanted to do a couple of years of research and then head off to do missionary work in Africa.

I remember not knowing exactly what I wanted to do. I had just found what I loved to do: developing open source GIS. It was not just developing anything. It had to be science and it had to be open. I remember dreaming about being able to develop any kind of tool for anyone and for free... right where big big companies were charging in an unfair way. I remember thinking that research should be for everyone out there. And I remember professor Rigon being of the exact same idea. 

At that time the slogan was: All in a aGIS!
We had figured that when it comes to environmental sciences, the glue to keep them all together could only be the GIS. With Riccardo we always joked about taking over ESRI at some point. Well, that one didn't work out that well. :-)

The first logo of HydroloGIS.

The second logo of HydroloGIS.

The current logo of HydroloGIS.


I told Silvia I thought she would be wasted for “normal” missionary work and that she should push her talents hard to do what many others would not be able to: create useful tools and then bring them developing countries together with training for it. And somehow I convinced her on something she didn't need to :-). 

I remember her telling me that most probably in about 5 years from that moment she would leave HydroloGIS anyways to follow her path in development countries.
I remember thinking: "It's ok even like that!". Being able to share a sparkling new experience with a pal that didn’t care a fig about making money exactly as I did, with the only wish to make science tools to release open source for the people… well, that was something that would not be easy to find again. We had to give it a try.

At that time she was following a master about project planning in Padova. One evening I was in the lab and she called me from Padova: “Are you serious about trying to create a company? There is this startup competition here... we could participate… everything needs to be delivered by midnight of today”. We chatted around for a short while, she gave me the link to the competition and then her cellphone battery died with her being spending the evening out (and not being easy to charge phones back then). I had no idea where to contact her again. I didn’t even know her home address at the time. I had to look up her parent’s phone in the paper phonebook (remember?) and call them to get Silvia's data for the contest. The lord meant it good to us, since during the following hours of struggle to write down the business plan idea and completing the competition bureaucracy also a name for the new company had to be chosen. Man, am I happy that HydroloGIS came that natural!

HydroloGIS at "Startcup"

Funny thing is that we wanted to try a startup competition to have confirmation about how good our idea was: Bring innovative open source technologies from the university to the professional world in order to make the world a better place. Sounds just about right, doesn't it?!?!?
Well, we didn’t even pass the first round!!! I remember project N.1 being a portable DNA analyzer device (I wonder where that company is today). We were so angry! How could they not understand!!!! So we decided to prove them wrong. And that is how HydroloGIS got born.


The really empty office of HydroloGIS at day 0. Those who now it now, would not recognize it.

We found shelter at the TIS Innovation Park Southtirol. At that time it was called BIC, the Business Innovation Center, which was an incubator and highly supportive for ideas both based on Environment and Open Source.

HydroloGIS, John Preston from the Jamaican reserach center ICENS and the University of Trento developed together JGrass, the open source GIS that wanted to be a userfriendly graphical interface for GRASS and specialize on hydro-geomorphological processing based on professor Rigon's past decade of research. 


The first JGrass logo, based on GRASS' logo

At that time the only development sponsorship to JGrass came from the MIGG course that we held with Rigon's team each year at the University of Trento.


And this was the first team preparing the course right after the MIGG2005 edition:

Andrea Cozzini, Erica Ghesla, Silvano Pisoni and HydroloGIS

Here the first JGrass versions have been developed.


One thing we have always been bad at was looking for work. At the very beginning we tried some commercial campaigns to sell HydroloGIS products around the region. Eventually we figured that it didn’t work. We have never been able to explain what we do properly and we simply didn’t have the skills to sell.

Luckily for us at the start there were some rather badly paid, but extremely interesting, projects with the university. Then later some jobs for government agencies came in. Interesting enough, we never looked for a job since then. The jobs just came to hunt us. And I mean it when I say "hunt". People started to come to us when they didn’t know where to head to solve their problems, usually after having tried for a while, hence burning both avaliable time and budget. And we took all those jobs, once again, bad paid and sometimes so demanding, that we had to work for free a long time to finish the job. Those were (hard but) great times, in which we grew incredibly from a professional point of view. But those were also hard times. And I exactly remember getting at the end of the year not having enough money to pay taxes. After a year spent working on average 15 hours a day!

But still we stuck to the plan: do everything the open source. It had to work!

Eventually one year passed and we were still in business:


and not in the worst shape (even if I was gaining quite som weight, eventually passing 100Kg :-) ):


In the years that followed (initially mainly on behalf of the University) we taught at several different courses and master courses, gave lessons at the university and to professionals, participated at many Conferences, EGUs and FOSS4G's, went to code sprints, developed GIS, made Engineering work, entered the OpenMI Steering Committee, the uDig Steering Committee, developed and coordinated JGrass, BeeGIS, the Nettools, the JGrasstools, Geopaparazzi and eventually won different innovation competitions.

Silvia winning the first price for innovative women entrepreneur.
GRASS code sprint in Prague.


JGrass went through many different periods. Being rejected from the GRASS community we had tried to develop it on our own, but it had overwhelmed us. we were not a pure software company.

A short history of JGrass until 2010, as presented at FOSS4G Sydney.

So in 2007 one big move had been done, the migration in what I was convinced was the best java open source desktop GIS (I still am convinced it has that potential): uDig


The first splashscreen of JGrass as uDig extension.


HydroloGIS, beyond others, teaching to high school teachers in Cape Town after the FOSS4G.


Talking about JGrass at Foss4G Sydney.


and having great fun at the same conference, always wearing the colors :-)


always ready to attend to important meetings to shout out our thoughts.

With the begin of my PhD at the University of Urbino a new open source door opened up. The mobile field mapping.

The BeeGIS extensions for uDig were developed in that context, which gained quite some interest. Being uDig based it worked only on full size pcs, or better tablets. Back then the big deal where Ultralight tablets, that had some complete-yet-downscaled operating system and were able to give enough juice to make uDig run on them. 


The splashscreen of the BeeGIS release for which ARPA Piemonte sponsored a nice part of development both for BeeGIS and uDig.


Digital field mapping as PhD student in Urbino.

Today I still have to laugh about that and I know some of you don't even remember. But tablets were heavy back then:

but everything is possible if you only want it:


In 2007 the first Geopaparazzi was born. And nothing has been as it was before :-)

We were finally able to have a tool that we would always have with us and with that we would be able to map in extreme situations:

Android made the BeeGIS project die out, because we simple stopped using it to develop the Geopaparazzi project, which, funny enough, turned out to be our most supported in the GFOSS world. There is even a facebook group for it now :-)


The years passed and many interesting things happened, as well as quite difficult things that hit hard on us. We tried to work tightly with other companies, which sometimes didn't work out well. We also tried to have employees, which did really work badly and we figured that would be something for when we are old :-). 

As I am writing this up now, overwhelmed by happiness and proud of what we achieved, all the bad things just vanish and I could go on telling you stories about our life, but I think it is really enough now. :-) It is really more material for a pub than a technical blog. But you got the point: I love the way HydroloGIS turned out, with its ups and downs.

The sole fact that few years ago I have been able to go back again to do music actively with my Alpentraum Orchestra, is a great indicator of having achieved what I wanted to: a job I love to work on every minute of the day and (some degree of) complete freedom in the organisation of time, which makes family and music possible.

Over time HydroloGIS made sense, even if they told us that it would not make sense to sell things for free and that we were crazy to do that in our niche of work... well, we were never able to properly explain it around here, we simply knew it was the right way. Eventually we figured that it was the somehow old Italian method that was wrong, not us. 
Our open source products and community involvement started to bring great jobs outside Italy and even overseas. While we still were not able to get work within a 100Km radius around our office (not one single job), we started to work in Germany, Finland, England, the United Arab Emirates, New York.

And obviously there were the projects in development countries, so important to Silvia :-). We were able to bring training sessions and our tools to Rwanda, Ethiopia and Kongo and work on water management systems. The sparkling new agreement with the GISMAP will help us to spread Geopaparazzi in the eastern side of the globe.

Silvia teaching Geopaparazzi in Arba Minch.

Teaching uDig and GIS at the University of Arba Minch.

Alright, I think I have kept you here for enough time now and my story is getting very confused. I know I missed many important things and people. Don't feel bad about it, this is a simple writedown, in a couple of hours, while browsing through old pictures and sensations.

One last thing I want to do is to thank those that believed in us even when there was no money and no future (well, that would be for about the first 6 years :-) ). Thanks to our families and partners, that supported us by any possible means. Thanks for being there, thanks for supporting without asking questions. Just thank you!


(In this picture, taken on HydroloGIS' 8th birthday, my mother and my sister Michela are missing. My mother was taking the picture and Michela lives too far away to be able to attend to every party we throw :-). I want them to know that they are part of it.)

Thanks also to Silvia, with who I had the luck to share these last 10 years. It has been sometimes difficult, she is soooooo hard-headed, but then I know I am too. :-) Thanks for letting me try all those things, even if no evident money would come out of it and we were starving :-) Thanks for being the other half of HydroloGIS.


HydroloGIS is Tony and Silli.

Last but not least, thanks to all of you that have sympathized with our concept of leading such a small company the meritocratic and open source way. We know you are out there and we have always been honoured when you told us how much you respect and like us.

Happy 10th birthday HydroloGIS, while my eyes are getting slightly wet...