Sunday, December 15, 2019

Geopaparazzi 6.0.1 released - geopackage support and labels

Well, the new geopaparazzi release had been requested by users that were not able to load spatialite tables that had > 3 dimensions. Indeed there was a bug that was giving that problem.

So we fixed the bug and since we had some quite tested code about Geopackage at hand, we tried to insert it and use it the same way we use Spatialite. It proved to be fairly easy and so we decided to bring out this version with the following support:

  • vectors (feature) layers: read, write (speak editing) and style mode, but for 4326 srid only (so that no reprojection is necessary)
  • tiles: but only for 3857 srid (so they fit in the current tiling system)


I personally think it is quite awesome. Geopackage is more limited than spatialite, but its data preparation tools are way more stable and spread around GIS environments. QGIS even uses it as its default vector format.

Also in the hortomachine project we have tools to quickly create geopackage databases, add shapefiles to them, tilesets from raster files and also to style the layers to be geopaparazzi ready.


One other thing we fixed is vector layer labelling. Many users have been crying about missing vector labels. Well, it has been really fun to see how many people and working groups of people use geopaparazzi with spatialite for their surveys. I really wish they would also contribute from time to time.

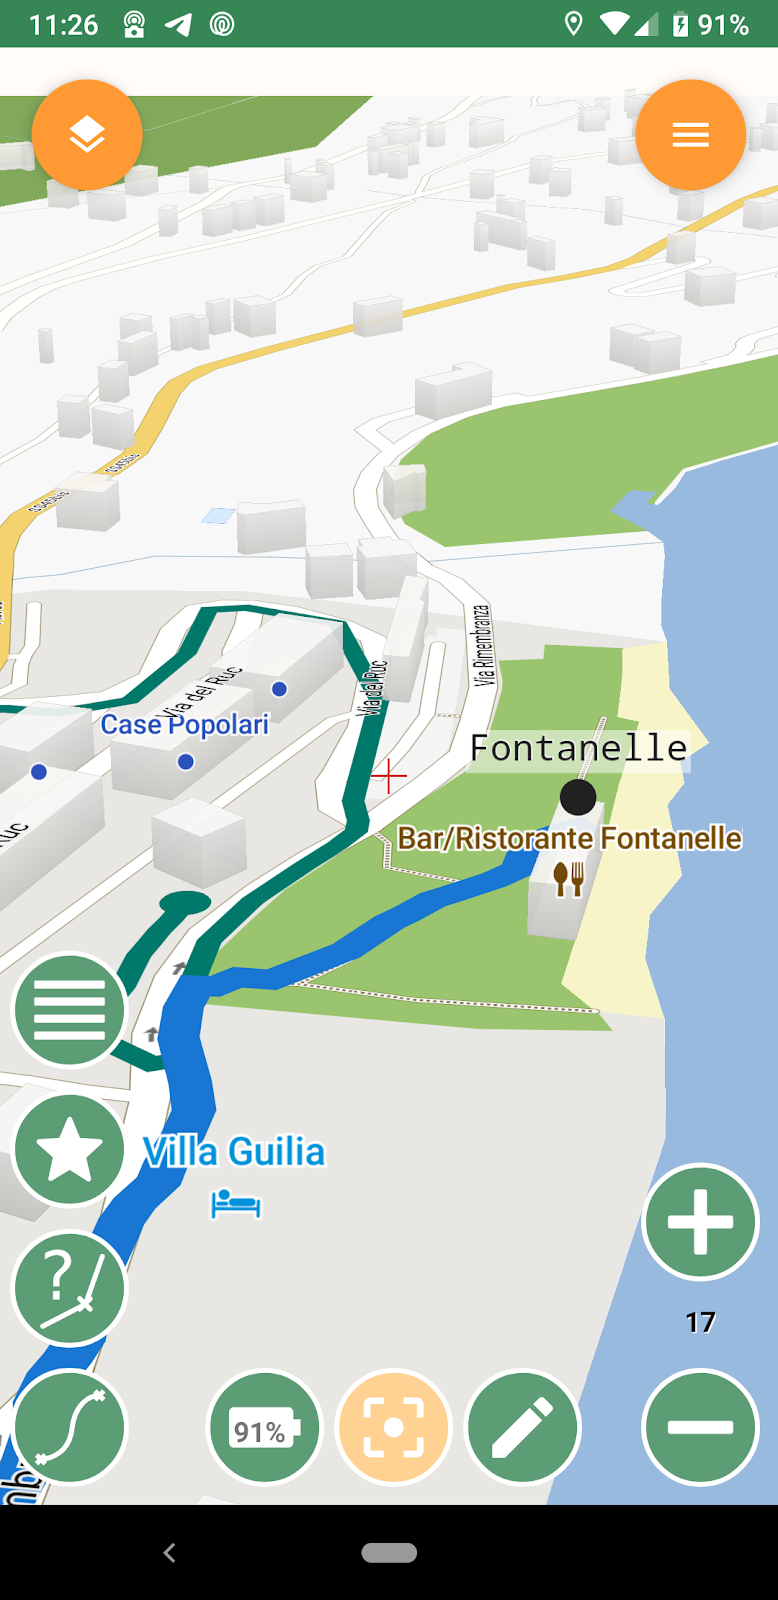
Anyways, we decided to add back vector labels. Given the limitations
imposed by the rendering framework, which would make things very
difficult in 3D space and add a layer to be handled for data layer, this is how we solved it, blocking the visualization of labels in the 2D space:


Might seem strange at first test, but I can assure you it works quite nicely.

There is also collision handling on a per layer  basis. This might show it better:


Enjoy!!


Monday, November 18, 2019

Geopaparazzi 6 is out. Now or never!

It has been an infinite time from the last geopaparazzi release. I only figured when I did the release. With all the work around the Geopaparazzi Survey Server and SMASH the main kid has been left behind.

So today it was the now or never. We are throwing Geopaparazzi out to the market. It will no doubt be the most important release of the year.

The new features can be found in this presentation:
https://www.slideshare.net/moovida/geopaparazzi-state-of-the-art-of-the-digital-field-mapping-application-167930916

Many thanks to several people that helped on the manuals, with fixes and features, that made descriptive and useful bug reports. Brent, Eli, Peter, Tim, Andrew, thanks for the support.

Things will still get quite crazy from here on. We are almost ready to add support for geopackage (also in editing mode... I hope), which is getting more and more used.

So enjoy. Test, Report issues. Enjoy!

Thursday, August 8, 2019

Geopaparazzi 6 betas - testers wanted

Dear all,
as you might have noticed, the upcoming geopaparazzi release will introduce huge changes due to the migration to the graphically accelerated VTM engine in substitution of the old version of mapsforge we were using and that was getting unusable due to https online resources policies on Android.


Also this version of geopaparazzi contains a sparkling new build of spatialite based on proj 6 and is available for 64bit devices. So this also will need some review to make sure it works on most devices.

All this allowed us to have several great functionalities as for example a 2.5 view


or the possibility to have multiple layers loaded (ex. mbtiles on top of online maps). Also this will soon open the possibility for vector tile layers, which is a huge improvement on the long run.

Being that many changes in the game, Brent Fraser suggested to make the beta release available for community testing and I agree with him.

The first beta release has been uploaded and a link will be placed and updated at the end of this post. Everyone can try it out, test it, let us know, possible in the issue tracker.

Each updated beta will have also the translations updated, if you need to check on some strings.

I am quite confident that we can make a beta release every day from now on, if there are changes in the code (fixes) or updated translations.

The links are directly going to the apk, so this can be smoothly done from the device.

Clearly this will also need an updated user manual, which is again a big task. Brent opened a ticket where the task can be monitored in the manual's issue tracker. If you are able to help, please get in touch with us.

My wish is to get the geopaparazzi 6 release out at the "Geopaparazzi: state of the art" presentation at Foss4G 2019.


Thanks to everyone.


List of betas (pick the first to get the newest):


Thursday, May 23, 2019

A new HM tool: the las info viewer

In the open source world there are by now several tools to visualize and manage pointclouds. Over the years in our field of study (forestry) we simply found that viewing pointclouds in 3D is fancy, everyone wants it, but in the end it is mostly useless. That is clearly just my opinion, since all the tools out there have a nice 3D view of the data. Still we felt we needed something more suitable for our needs. And since the Hortonmachine already has a lot of tools to handle las data, why not aggregate them into a simple viewer that would allow us to quickly analyze a set of data, visually understand its issues, content, outlayers, intensity variations, etc etc?

Let's have a look at what we came up til now.

The viewer: once you open it, looks like this:


You can load las/laz files and set filters on any of the properties of a las point, as well as define a subregion or some subsampling. This is particularly useful when you load huge datasets as for example terrestrial scans.

First, let's load a aerial scan from our local administration:


Some header information about the file is shown as well as information about the first point of the file.
By default coloring is done based on elevation.

But one can select also intensity:


A popup on the map view shows some stats about the currently visible data. There for example we can see that intensity reaches over 5000.

Let's try to set an intensity range filter between 0 and 500. The result now is:


Hmmm, it seems we still have some "outlayers". Let's check all the points in which intensity is higher than 300 then:


It seems save to filter some more, let's say 0 to 300:


Well, better, but intensity is anyways always a mess in las data :-D

Let's have  a look at classification:


or impulses (they might be handy to understand smaller areas?):


Well, maybe we could add a DTM and have a feeling about the canopy height model (switching back to coloring by elevation)?


Hmmm, coloring looks odd, there might be some outlayers... the stats, now that the DTM is involved, also tell us the height from the ground. It seems we have trees of around 500 meters. Let's have a look where all point with height major than 80 meters are placed:


Oh, look, this seems a border problem coming from the difference with the DTM. Well, let's just get rid of them by selecting a smaller region:


and load it:


Now this looks way better. Maybe let's try to filter away the ground by thresholding the data post DTM difference at 1.3 meters:


Just know that you can export what you see as new las file or shapefile and use that for some further analyses.

But let us see an example with a more dense pointcloud, coming from a terrestrial laser scan done at the University.

Since the las file is of 3 giga, if is safe to first load it with a sumsampling of 1 point every 1000:


Then we can narrow down the area and reload the data without subsampling:


Looking at the first point table we see that the point's color information is available. Let's use that coloring:


By selecting a subregion and pushing the 3D button we can also check where the markers were placed and where we left our bag :-D


or maybe check the scan area:


It is also possible to enable the horizontal slicing mode. Once done and defined the slice interval and the width of each slice, you can load the data. This will populate the slices combobox with the different slice elevations. By selecting one, the map view will update with the slice:


Let's look for a slice where the trees are better identified:


And now push the extract circles button (mind, the tools is highly experimental and will need some love in future):


You will find that the trees extraction is not so bad (there are some false positives and negatives) and it nicely keeps the information about the radius. If your data had a proper referencing you can then export those to a shapefile.

Conclusions

This is a usual tool done without funding to help us doing our daily job. As such you have to know how to use it and maybe get used to it, else it will turn against you and make you crazy. Also it is not particularly memory saving, even if one can decide what to load into memory.

That said, we will put it in the next hortonmachine release, so if you like, enjoy it!