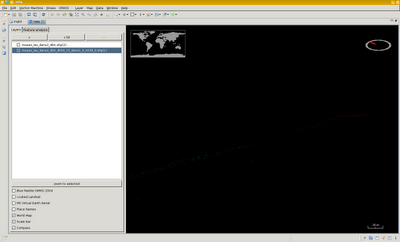
Do you know what this is?
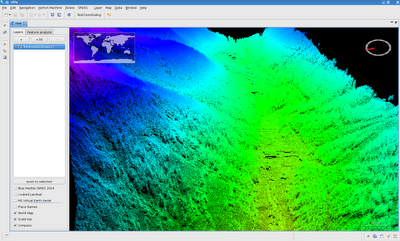
More than 7.000.000 of points rendered in JGrass from a las file. Yes, It does look awsome and is well navigable (with enough ram and videocard :)).
How? By putting Nasa World Wind as a plugin into JGrass and tweak a bit the OpenGL rendering through the jogl libraries.
Why? Prototyping around extraction of powerlines.
Want to know more? What happened next?
Well... we were asked to explore a bit with feature extraction from lidar data, starting fromm the most difficult: powerlines.
While prototyping we added some tools to read las files and filter the signals through intensity, density of points, elevation difference with the dtm and things like that. Well the result up to now is pretty nice...
Ok, first let's extract the data inside a polygon... now can you see the powerlines?
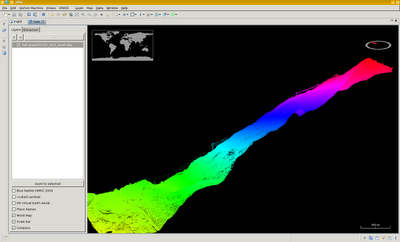
Ok, let's change the coloring... no more elevation based, but intensity based:
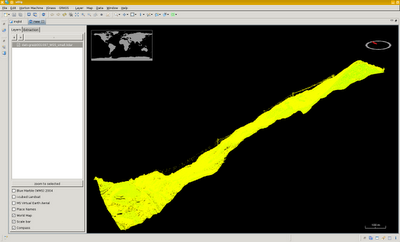
And here we zoom in and color based on point density (in 3d), now the powerlines are already colored differently from most of the rest.
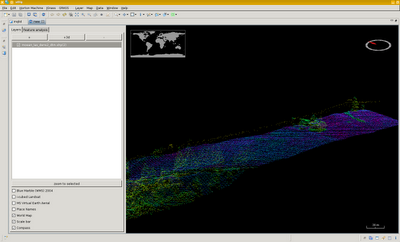
Some filtering based on intensity, density and elevation difference with the dtm and here we go (it looks empty, but have a closer look):
Let's get back to 2d using a small partial example, how does that look like?
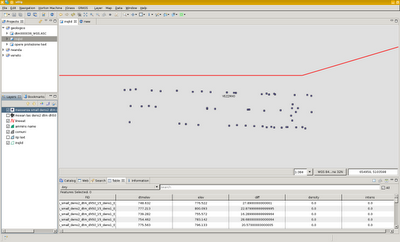
Hmmmm, looks that one of the two is a bit wrongly placed... let's check:
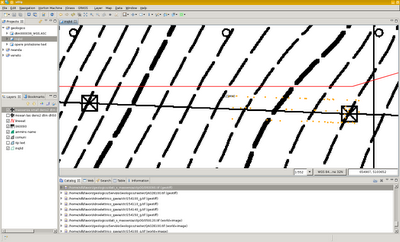
Seems we are right? Check with the aerial photo:
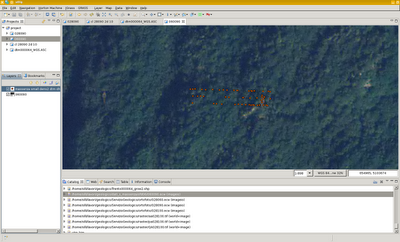
Aha, so we are right...
Well, this is just the first part, but it already look promising.
Looking forward to mature this plugin to get it into the JGrass plugins that are going to be released.
8 comments:
Did you simply load the points up into a large display list or have you developed an underlying tile tree (octiles/quadtiles). Here is our NetCDF sample, developed by the glob3 project http://dl.dropbox.com/u/15821898/vlc-output.mp4 .
Woot what_nick, your application is simply amazing! I really like it. I have the glob3 project in my todo list, but didn't look into it yet.
To also answer you: no, the examples in the post is completely in memory and has not optimization. It was a prototype through which I hope to get fundings to implement the 3D part in uDig.
I will sign up to the Geotools and UDig lists and start up discussions on our NetCDF activities there. We have the mandate to implement 3D visualisation tools for Ocean data and look forward to collaborating.
Please do so. The latest imageio-ext is coming out and I will re-enable netcdf support in uDig soon. It would be very good to understand if there are common requirements and where we can help each other.
I would be very interested in having a 3D view in uDig...
I'm newbie to jgrass and uDig and I would like to process (dtm creation) some lidar (LAS) data. I installed uDig and jgrass (all in one bundle) from jgrass website... Now I'm lost with installation of all these plugins, dont know which one, where to get them and how to include them.
Can somebody please tell me the flow how to install everything so I can process those *.las data.
Thanks
Hi Anonymous, I am afraid this prototype plugin never made it into the release and plugin system. We never had fundings to clean it up to be uDig compliant and get it out in the open space.
I'm an architectural engineer. I need to measures distance so accurately for every project. I always a Lidar to measures the distance. I am very satisfied by using this. Best Lidar scanner Calgary, Alberta
Post a Comment