Tuesday, December 28, 2010

Geopaparazzi 2 released


Well, it had to come finally. The version 2 of Geopaparazzi is finally in the market. Not much more to say more than I did already in the last posts.

Just to summarize a bit:

release notes for version 2.0.0

New features:

  • complete new graphical interface rewrite following the google design guidelines

  • support for customized json forms

  • actionbar also in mapview

  • better navigation buttons in mapview

  • panic button and send position button are now split

  • moved the maps cache out of the geopap folder for better reuse


Fixes:

  • tons of code revies and tweaks

  • moved all hardcoded guis to xml

  • much better interaction in maps lists

  • logs now have proper end timestamp


The documentation entry page is here.


With this release we also decided to release the old version for free in the market, so if you search for geopaparazzi or geopaparazzi 1, the free version should appear ready to be installed.


That said, Season Greetings to everyone. I hope you all had a nice Xmas and are heading to an amazing new year's eve!!

Friday, December 24, 2010

Geopaparazzi Xmas Gift

It is Xmas and I just finished to write the manual for the Geopaparazzi 2.0 version.

For those that want to browse a bit the new fucntionalities waiting for the release,


Well, I am shutting down everything and head to the Xmas Market to warm up my spirit with some mulled wine to properly prepare for the evening.

Happy Xmas to everyone!!

Thursday, December 23, 2010

Geopaparazzi 2.0.0 Xmas preview

This year's Xmas gift is a complete change of geopaparazzi's usability and several new features.
This forced us to get out a 2 version, but well, I hope we will be sticking on that one for a long long while.

A couple of preview shots:

Finding the google design tips really good, I decided geopaparazzi needed more gui love, with a nice dashboard and always available actionbar, as well as better logging handling and blah blah, gui, blah... The result is this:


There are now those small wonderthings that make me hot on stylish mobile apps.

Gps info pops out like this:


There is one single button for notes. Once touched, it presents all 3 options:


The logging has now a safer way to turn loggin on and off:


As I said before, the action bar is now available also in the map view, which also got added the center on gps button:


And yes, also notes of different types can be taken from here:


But the most (or second most) amazing news here is the support for structured notes. It is possible to describe buttons and forms through json files, that then generate the needed guis for the creation of notes:


And that one is really something I like :)
The kml export now exports those notes embedding tables inside the notes itself. This leads to extremly nice results of superfast surveys.
On the BeeGIS import side we still have to work a bit to see how to handle those. One idea is to create shapefiles containing the form fields as attribute table. The doors are open.

Well, I can't leave without a screen about the panic action. Since many were using the panic action just to send their position, the panic action kind of lost its sense. Therefore we decidd to give two status updates with different messages in the sent sms:


I really wanted to get this out today, but we need to do more testing and ask the translators for their updates. Will be out as soon as possible!!

Sunday, December 5, 2010

Another bit of grace of uDig to simplify the concept of Location

With the jgrasstools effort we also are abstracting the whole raster formats, which before was just the GRASS binary raster format, to be whatever a geotools GridCoverage can be. This is/will make it easy to anyone to run the processing algorithms on any geotiff the same way as on en ESRI ascii grid.

Taking a bit the distance from the GRASS location and mapset concept was one of the things that we thought would help us a bit, since we are often in the middle of two worlds, between userfriendlyness seeking users and in-assembly-thinking academics. :)

Well, as stated at the begin, we chose to be able to use the jgrasstools on any raster format directly.

At our last JGrass course however we figured out that some users will simply make incredible mistakes without any guiding hand, speak: without locking them into a geographically well defined workspace, inside which they at least do not screw up the projection information.

And that is the GRASS location. As akward it is always for the users to first understand the purpose and meaning of location and mapset, it afterwards might save their lives.

So we made a new try. Which is to create a bunch of small tools that would help people get in and out of a GRASS location, as if it was a folder somewhere on the system.
Tools to handle a bit automagically the active region concept.
Tools that would help users to get started with the hated geotiff that they got from their local administration.

So the most important bit is probably the fact that now we can create a Location and mapset directly from an input file:
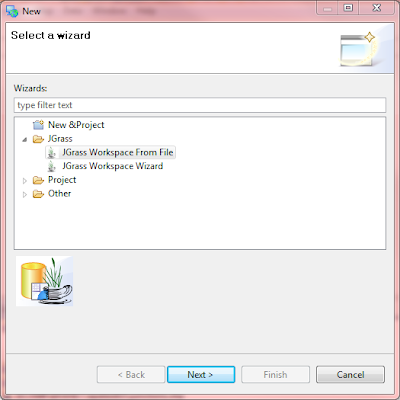


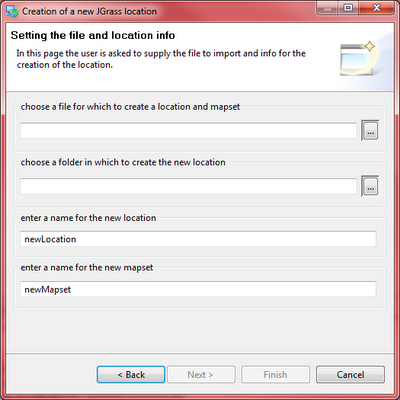
This right now supports geotiffs and esri ascii grids that have information about the projection they are in (prj file mostly). Set file and names for the location and mapset and you are ready to start:


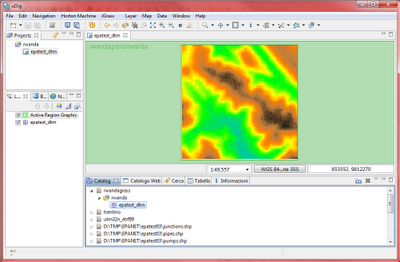
The active region has been made a bit more responsive to what happenes. On the left upper side it shows you permanently to what location and mapset it is referring to, so that no user can be confused again about which mapset it is using for processing:


The catalog JGrass service has been empowered:
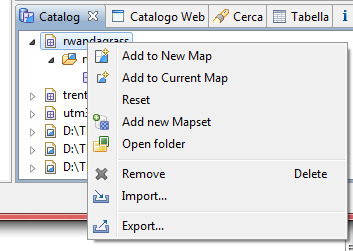


By rightclicking on the location you now can:
* open the system filebrowser on the location. This is particuary handy when you want to rename a mapset for example
* add a new mapset to the selected location

The same applies for the mapsets:
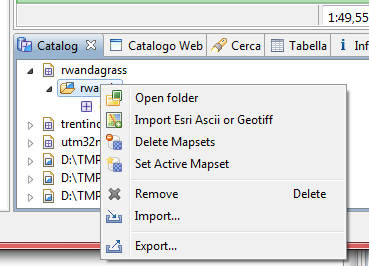


By rightclicking on a mapset you now can:
* same as for the location open the mapset folder with your system file browser
* import dirctly into the mapset an esrii ascii or a geotiff. Files in different projection than the mapset will be reprojected on their way in
* delete a mapset from the location
* set the selected mapset as the active one for all processing done. The active region for this mapset will be shown to highlight the processing region that will be used. This had to be done in the settings before.


And finally we have the map actions:
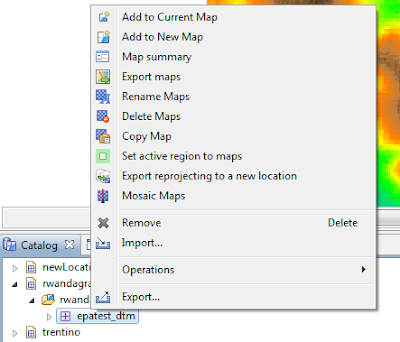


From here you can:
* trigger a map summary for a quick statistic on the selected raster
* export maps (also multiple in one go) directly to esri ascii grid and geotiffs
* rename maps
* remove maps
* copy a map on the active region. This is usually usefull, since at the begin the user will ave a DTM of a larger area than the one to study. Once defined the area of interest, simply select with the active region bbox selector that smaller area and copy the map. It will be cut on the active region
* set the active region to te selected raster map. If more than one map is selected, the active region will be expanded to contain them all
* reproject a map by directly creating a new location and/or mapset
* mosaci maps, i.e. patch them together. If you have 4 maps that contain parts of your area of interest (following Murphys law, it will be placed in the corner of all four), you probably want to first patch the maps and then extract the smaller region of interest


I guess that's it. While I believe that some of you reading this will think: how the hell should this be usefull? others will definitely count the time to get the next release of uDig. Because yes, most of the above is in uDig, even without JGrass extentions. Not that you would do much from here on with a raster and without JGrass :)


Oh, and BTW, the geosilk iconset rocks!


-----
update: had to change the map actions screenshot, since I was forgetting the mapreprojection to new location

Wednesday, November 17, 2010

geopaparazzi 1.2.0 released

Today we released geopaparazzi 1.2.0 just in time for our GFOSS.it conference lab and presentations

So the features and fixes that got into the release are:

New features
* audio recording button
* the panic button (send sms with position update to a preconfigured phone number)
* added gps exif tags into the pictures taken

New Localization:
* added Sinhala translation

Fixes:
* sms catcher was crashing when application not in foreground
And the mandatory screenshot:


Tested phones are listed here.

Saturday, November 13, 2010

geopaparazzi gets the PANIC! button

In the upcoming release of geopaparazzi there will be three main additions:

1) the Sinhala translation
2) the possibility to not only take pictures and georeference them, but also recorded audio

and...

3) the PANIC! button


What would that be? Well, I figured out that my bussiness partner would use it for surveying, my dad would use it to trace mushrooms places somewhere off the track and my girlfriend would use it to log her infinite mountainbike trips. We wanted something that would send out the current position to a preconfigured telephone number with a simple click in the case of problems. Well, that's all that it does... push the button, push push the button! :)
Friday, November 12, 2010

uDig styles and filters - human readable... the fun is on!!!

You might remember my post about udig and filters, where I stated that filters were given in xml form. Well, thanks to a good comment of Andrea Aime, I tried a simple tweak and now we have filters in a simple and easy human readable form, supporting the amazing power of geotools' filter mechanics.
Thank God those guys exist :)

An example?

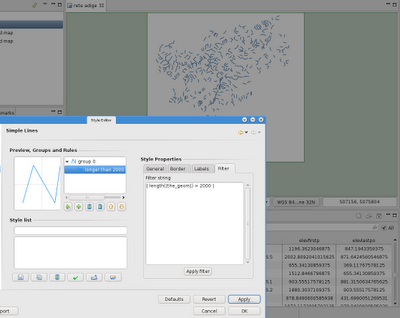
I have a map with rivers in it:


Now I want to create a rule that only displays those rivers that are longer than 2000 meters. The CQL function length comes to help me. Insert it into the filter textbox, press the apply button and here we go:


It is easy now to add in another rule and color those that are shorter than 2000 meters:


Nice ha? coming in your next uDig release :)


PS: some examples from the geotools site.

Thursday, November 4, 2010

Install JGrass on uDig 1.2

It is now more than one week that the JGrass site is down and our providers are not able to get it up again, I am going to post a very short workaround for people that want to install JGrass and get started anyways.

So first get the newest version by installing uDig 1.2 from the main download site. Make sure to download version 1.2.

Then install the latest JGrass plugins in uDig. There is a great presentation by Silvia that explains how to do that:
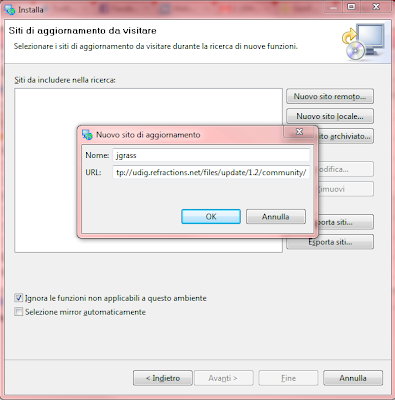
Have a look at the first slides to see how to do the install. The only thing that changes is that in this version of uDig the urls of the update sites are missing. So, when it comes to the slide 9, you will have nothing and will have to add a new remote site. This is simply done by pushing that button and adding the following url into it:

http://udig.refractions.net/files/update/1.2/community/

It should then look like the following:


At that point you can follow back the slides.


If you need an introduction on the use of JGrass, follow the presentation until its end.

Tuesday, November 2, 2010

Geopaparazzi 1.1.1 released

Today we released Geopaparazzi 1.1.1 to the android market. Some info:

New features:

  • SMS catcher for finding surveyor through an sms
  • better handling of gps log names
  • better note insertion gui

New Localization:

  • added Spanish translation (thanks Camilla Archetti)
  • added Finnish translation (thanks Juha Valtanen)
  • added German translation (thanks Matthias Lendholt)

Fixes:

  • fixed small delay in getting the old gps data on screen rotation
  • gps log list sorted to have most recent on top


You have wishes for new features? Add them here.

Monday, November 1, 2010

uDig styles and filters

When it comes to filters in SLD it gets really hairy. Filters can be really everything, from an constant value to a complex nested operation on properties. It is one of those things with superpowers but also scary when it comes to the moment to create a gui for it.

So what we decided to do for now, is to expose the pieces of xml that represents the filter part in a rule. Sure it is only for the brave, but even if you do not edit it, you can at least get some useful info out of it.

Let's for example start with a themed style with only two classes:


if you go to the simple polygon style panel now, you will find a new tab, which states Filter. Inside that you now find the current filter definistion (if one is in).


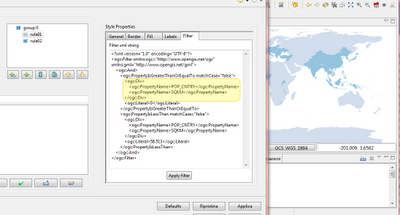
In this case it gets how the themed styles work, right? As highlighted in the following screenshot, the filter states that the first rule is applied if:
* the property POP_CNTRY >= 0
* AND
* the property POP_CNTRY < 50000

That is how themed style works. A set of rules is created with filters in a row.


You may have noticed that some countries have disappeared in the previous image. That is because in the previous image I changed the upper limit of the first rule to 50000, while it was different in the first screenshots.

So you really can modify the filter as you which. You have then to make sure you push the Apply Filter button. At that point the filter will replace the previous filter in the style.

Just to give you one more example of what you can do, here is how normalization works. Imagine you want to style the population attribute, but normalized on the area, so that it gives a better idea of population density. That is how to change the filter for it:


What you are saying now is that the first rule is applied if:
* the property POP_CNTRY divided by the property SQKM is >= 0
* AND
* the property POP_CNTRY divided by the property SQKM is < 58.513

One last hint though. Don't do this by hand, in uDig for doing normalization we have a button on the themed style page :)

Wednesday, October 20, 2010

Geopaparazzi 1.1

Geopaparazzi 1.1 has just been released to the Android Market.

This version now needs 1.6 (Donut) Android as minimum OS, since that is needed to support multiple screens.

Main changes:
* Italian translation
* support for multiple screens (from HTC Wildfire to Galaxy Tab)

Visit www.geopaparazzi.eu for documentation.
Release notes are here.

Friday, October 8, 2010

First small JGrass tools migrate to uDig

You might be thinking I am crazy, but I was waiting for this post since at least 2 years now, i.e. from the day I decided to merge JGrass into the uDig community. I never did regret the move, but I had hard times to get at least the general purpose GIS stuff of JGrass into uDig. But that last hurdle seems to be gone now.

So let me do a quick summary of what got already into the udig core (i.e. next udig releases will show them) and what will come next:

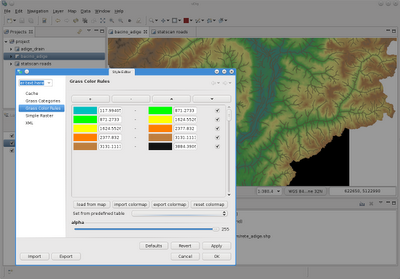
1) one of the most important one for me was having support for the GRASS format. And here it is finally.

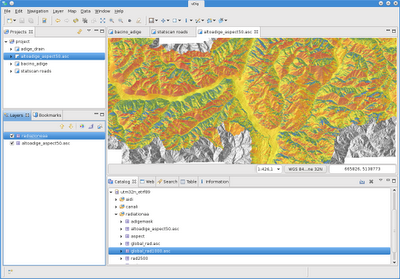
You can now import grass locations into uDig directly and visualize/use the rasters contained.


Also you can define colorrules and (!) categories.


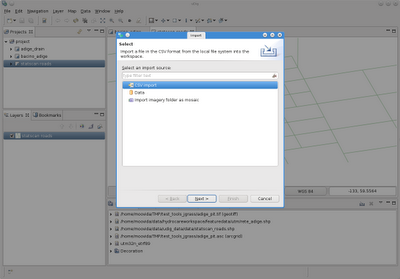
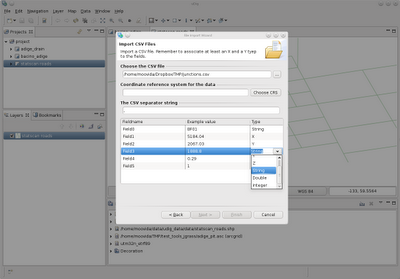
2) The csv import tool

Not much to say, you have a comma separated values file that contains point coordinates, go to the import wizard, check csv import


configure how you want the resulting feature layer and you are done


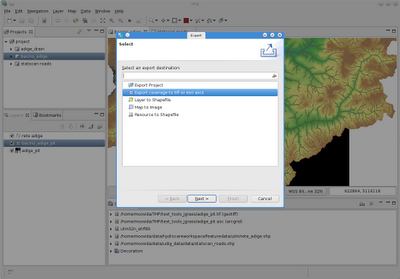
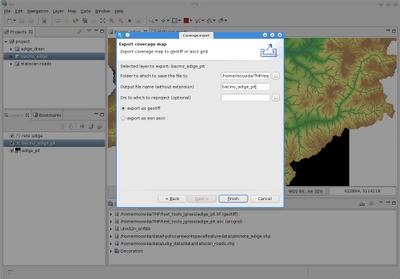
3) Coverage export

It is now possible to export coverage layers to geotiff or esrii ascii maps. Starting from the export wizard


it is also possible to perform a reprojection during the export.


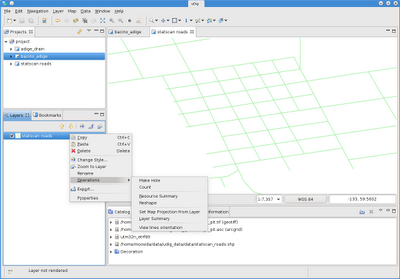
4) View line orientations

This might be of few help to some, but might be life/time saving to others. I much to often need to know the orientation of the lines that were digitalized. By selecting a line layer and opening the operations menu


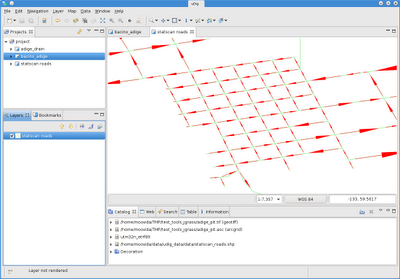
this is now shown to you through arrows


5) The coverage info tool

The info tool now also understands coverages. Therefore if you pic with the info tool over a map, now also the coverage layers are taken into account


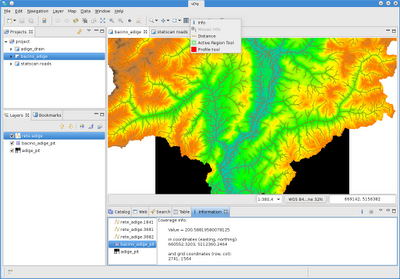
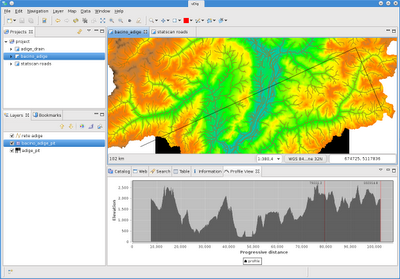
6) The profile tool

A profile tool for raster maps is now available. It is available under the info tools (the one with the red icon, indicating that there is a problem with the icon, has to be solved still)


Once activated, the selected layer's coverage is read and we can use the tool to draw lines (same as with the distance tool). The profile view opens up and the resulting profile is shown as it proceeds. Red markers are shown in the click points.


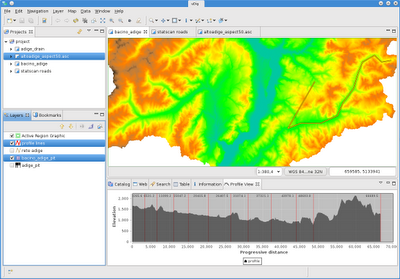
There is also a second mode to use the profile tool, which is through an existing feature.
To use that you have to select the feature layer and the raster layer you want to use for the elevations. Then you select the line feature you want to use for the profile.
From the operations menu choose: Feature on Coverage profile
You will get something like the following, having a marker in every node of the line


I feel good, I knew that I would!
Next are all the advanced style features and the netcdf format support.

Tuesday, September 28, 2010

The form editor - work in progress

I want to give a small preview of what the new form editor for creating dynamic and flexible forms in BeeGIS will look like. On one hand because it is coming quite nice and on the other to show to those that pay us on this (ARPA Piemonte) that we are getting closer.

Well, what would a form editor be? A tool to create forms to make surveying easier and also more standard. Once a form is defined for a certain shapefile, attributes of the features in the file can be modified in the same way by everyone through the form. I do not want to describe further here, that will be a task for the manual writers.

Let's see where we are now.

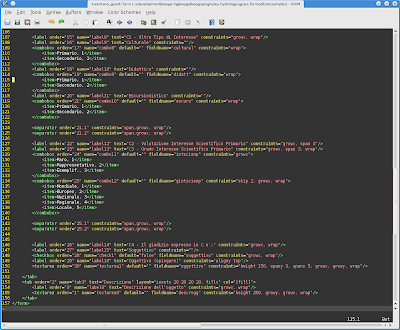
The "form language" has been defined on an xml base, so a file that looks like that


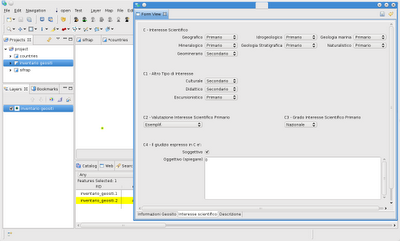
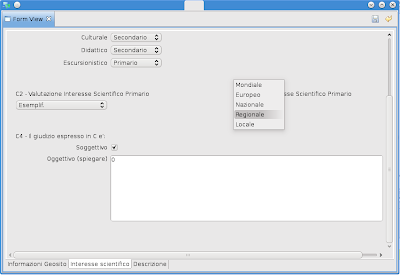
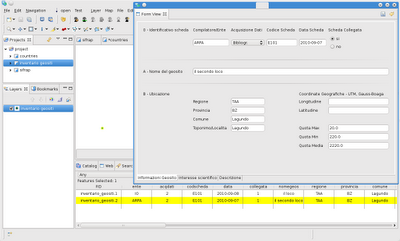
will produce a graphcial interface for feature editing like this one


This is a quite complex one and has more then one tab


Comboboxes can be described in a human readable way, while they modify the attributes with codes:


Well, yes, who would write such an xml to get a complex form? How long would it take. It took me about 2 hours to create the one I am showing here, but do not despair, we won't let users alone.

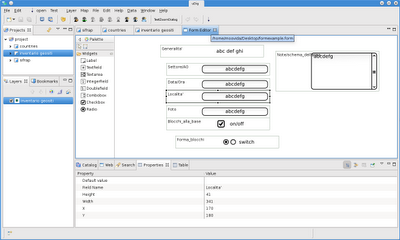
In fact there is also a form editor in progress that will make the generation of form files easy.

I will make the huge error to show you what it will more or less look like, but I also warn you that this is just a first draft prototype, things might change at least a bit.


Saturday, September 25, 2010

Geopaparazzi is out!


Today we finally released the first version of Geopaparazzi on the android market. The project is released under GPLv3 an available on the homepage of the project.

Geopaparazzi is a tool developed to supprot very fast qualitative engineering/geologic surveys. It integrates completely with the BeeGIS digital tablet extentions, i.e. the data are imported straight into the GIS from the phone for further processing. See this link for an example.

Geopaparazzi is sold on the Android market and supports the development of Geopaprazzi itself as well as the projects developed by the same team: JGrass, JGrassTools and BeeGIS.

That said, I leave you to the documentation on the main website.

Friday, September 10, 2010

Distributing 'em around: hg and git

Well, well, finally it seems that we are all moving to distributed versioning systems...


uDig is now out at: http://gitorious.org/udig


together with JGrass as subproject: http://gitorious.org/udig/jgrass


jgrasstools home is: http://www.jgrasstools.org


beegis is slowly settling at: http://code.google.com/p/beegis


geopaparazzi is at: http://www.geopaparazzi.eu


Guess this is it, quite evenly distributed between git and mercurial.

Thursday, August 26, 2010

SWT, Tabfolder and ScrolledComposite

Every time I have to create a scrolled tabfolder, it is the same. I have to fiddle around to make it work nicely. Around the net I can't find a good and complete example.

So here is how I solved it. Didn't have time to clean the code up. Remove objects you don't need and if you have troubles, just ping me. Hope this helps someone.
Here we go:


// create the tab folder
final CTabFolder folder = new CTabFolder(parent, SWT.BOTTOM);
folder.setUnselectedCloseVisible(false);
folder.setLayout(new FillLayout());

// for every Tab object create a tab
List orderedTabs = form.getOrderedTabs();
boolean first = true;
for( Tab orderedTab : orderedTabs ) {
// the tabitem
CTabItem tab = new CTabItem(folder, SWT.NONE);
tab.setText(orderedTab.text);
if (first) {
// select the first tab
folder.setSelection(tab);
first = false;
}

// we want the content to scroll
final ScrolledComposite scroller = new ScrolledComposite(folder, SWT.V_SCROLL);
scroller.setLayout(new FillLayout());

// the actual content of the tab
Composite tabComposite = new Composite(scroller, SWT.NONE);
tabComposite.setLayout(new MigLayout(orderedTab.layoutConstraints, orderedTab.colConstraints));

// which goes as content to the scrolled composite
scroller.setContent(tabComposite);
scroller.setExpandVertical(true);
scroller.setExpandHorizontal(true);
scroller.setMinHeight(folder.computeSize(SWT.DEFAULT, SWT.DEFAULT).y);
scroller.addControlListener(new ControlAdapter(){
public void controlResized( ControlEvent e ) {
// recalculate height in case the resize makes texts
// wrap or things happen that require it
Rectangle r = scroller.getClientArea();
scroller.setMinHeight(folder.computeSize(SWT.DEFAULT, r.height).y);
}
});

// the scroller gets the control of the tab item
tab.setControl(scroller);


// add things to the tab composite
List< ? extends FormElement> orderedElements = orderedTab.getOrderedElements();
for( FormElement orderedGuiElement : orderedElements ) {
FormGuiElement formGui = FormGuiFactory.createFormGui(orderedGuiElement);
formGui.makeGui(tabComposite);
}
}

Friday, August 20, 2010

Labels and Raster color masks

A quick update on the style editors for uDig for those who care.
The labels part and a raster color mask is now there for testing.

1) Example about lines labels

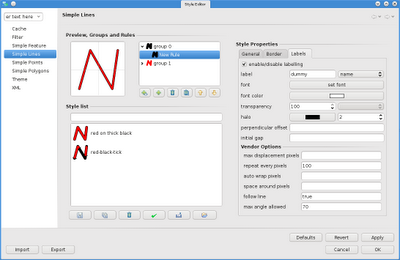
Now all the feature style panels have a labels panel added:


from there you can do several stuff, I will just show the labelling of lines here.

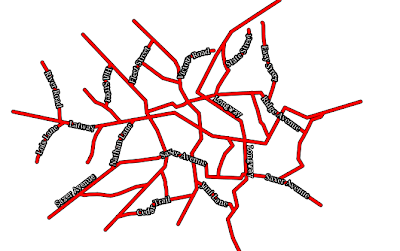
More or less I tried to support everything that gepotools does (some of it is taken from the sld cookbook of the geoserver community).

So the result would be:


2) Another thing that has been missing for a while in uDig is the possibility to create an alpha mask based on a color for imagery.

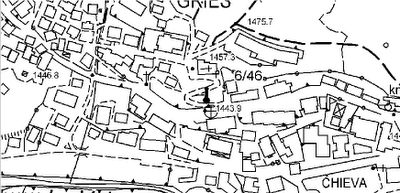
If for example I have a tecnical map:


which I would love to see in overlay with an ortophoto, I now can go into the style options and set a color to alpha:


Which then would lead to have the wanted overlay:


Sadly this last is not something that is supported in the SLD specs (so they tell me), so it can't be persisted in a sld file. However it might be added to geotools as a vendor option. That would be awesome. For now, I'll enjoy it in uDig...