Thursday, May 21, 2020

SMASH 1.2.0 is out... and it is packed with goodies!

SMASH 1.2.0 is out in the google and apple stores and it comes packed with a whole set of new features. Not even sure where to start. Here we go...

Welcome and Project View

We never had it, but it was time.When SMASH starts up it need to check some permissions, layers, data, forms and much more. Now you will be notified and see something is going on:


After that the projects view comes. Make your choice, new/old or fast choice between recent?


Data formats

Some new formats are available now.

Raster files in World image format

SMASH now supports loading of raster imagery in the tiff/jpg/png + worldfile (tfw/jgw/pgw) + projection file.

So once you load the rasters in the layer view, it will check the projection.

In this case we have 3 different projections and while 4326 and 3857 are supported. So the first time this happens you will need to tap on the layer to try to download the proj definition for the projection.
If you are lucky enough, the epsg was recognized and the definition downloaded. Now the dataset is loaded. Mind that while on vector data a re-projection is really performed, in case of raster images, the images is just warped using the boundaries. So this could lead to some unwanted distortions. So always bet to use 4326 data for rasters.
The result is quite nice and transparency can be applied where needed.
Here below a jpg loaded in 32632:


 and a tiff loaded in 3857:


Small confession: this is the reason there has been also a version 1.1.0. We found out there were some issues with the projection of the raster imagery files and decided to fix them an release right away.

Shapefile read support

SMASH now supports shapefiles ( outch, who would want them?). 


And they are actually styled with SLD:


And can be queried:


They are and will always be (unless someone pays tons of money) read-only layers. All the editing will be moved to geopackage in future.

WMS/TMS support

TMS has already been supported, now WMS is also here. And there is a beautiful catalog to hold them:


The maps are actually live maps which help to see if a service works even before adding it.

WMS looks the same and both can export and import the definitions:


To add a new definition, since that is a rude thing to do on the device, we tried to make it as comfortable as possible:
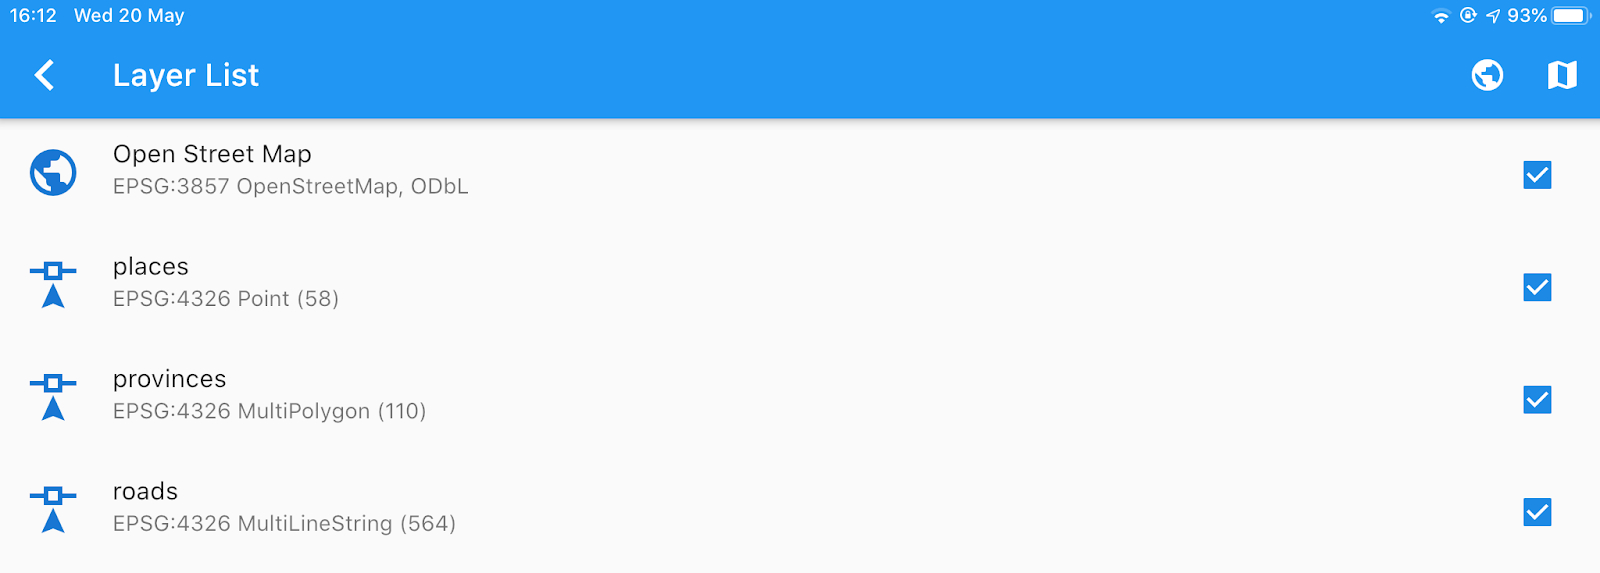

Layer management

Layers can now be dragged to reorder them and they can be removed with a right-to-left swipe.
If they support zooming to or styling, it is found in a right-to-left swipe.


Note that this is now harmonized in all list views with zoom and style.

Notes:


and logs:


GPS 

The biggest new is for sure the fact that SMASH now supports background logging, i.e. logging with the screen off. No image here, but you know what that means.

We also added to the settings view:


a GPS live view to be able to play with the settings and see what happens:


As you can see the rose of incoming points is visible in the background, so give an idea of what is going on.


Last but not least, it is possible to activate a counter for GPS points (all vs filtered) to be seen on the main view in the GPS icon:


Other notable things

Debug view

We added a debug view, accessible from the settings:


Better drawers layout

The left and right drawer and the actionbar have been reviewed.
The right drawer is now accessible by icon and contains all the tools, in expandable sumenus.


 As a result the left drawer is now more clean and project related:


And an online help has been added, which is never bad :-)

The GPS info panel has been cleaned up a bit and one can copy each coordinate to the clipboard:


 Notes have labels

We added labels also to project notes:


Grid 

A nice grid plugin has been added to flutter map, so we added it here also:


 Reprojection support

As mentioned in the raster imagery part, support has been added for projections. If a projection is not known, it will be required to download its definition. After that vector data will be reprojected properly. This part is still a bit experimental. But it already looks good.


Small things

  • sharing the position has now the Openstreetmap url
  • fixes have been done in the forms engine

 Guess that is all! Enjoy!

PS: as usual the user manual is lagging behind a version. Is there some gentle soul out there that would be willing to help?

Monday, May 18, 2020

Geopaparazzi vs. ESRI Collector - a user story

Andrew Mitchell appeared a couple of years ago in the geopaparazzi community and soon marked a differenece. It is one of those users that put effort in making the tool they use better. He soon started to open issues about usability... many issues. And those many issues made me crazy, since he was right and most of the time I had to react with improvements and fixes, but also contributed to a better geopaparazzi.

A couple of days ago he shared his experience on the field with Geopaparazzi and with ESRI Collector. Needless to say that I loved the read.

Pasting the whole content here as it was sent to the geopaparazzi mailinglist:


ESRI Collector vs Geopaparazzi
Background Information
Most environmental consulting firms use Collector. It is the defacto industry standard for GIS data collection. However, I have on most occasions had serious issues with it and now use Geopaparazzi. The following table provides a comparison between the two systems based on slightly more that a years of practice with both systems. In most cases, I would start with Collector and then switch over to Geoparazzi when Collector experienced an issue that was hard to work around. That said, others found Collector to be fine and stable. It could be that the iPhone version is better than the Android version. Even so, many limitations would remain. This review concentrated on issues that have caused grief in the field, rather than what works well.
Geopaparazzi has fewer issues, but some occasionally arise, particularly teething issues with the new version 6. However, any serious issues have rapidly been resolved. At the time of writing Geopaparazzi 6.0.3 was being compared with an up-to-date, professionally managed ESRI ecosystem. 

Collector
Geopaparazzi
Primarily an online data collection system with an off-line capability
Began as an off-line system but has ability to utilise some cloud services for importing base data and form designs. Does not appear to have the ability to upload new or updated data to a live GIS system.
Projects are created in ArcGIS Pro then delivered to an Android device by cellular network
- downloads can be painfully slow
- it is also confusing when you open a downloaded project and are outside the project area as the imagery for your current location will be shown, not the imagery for the defined project area.

Project usually created on the fly on the device by starting a new project.
- loading base maps or spatialite data via USB is very simple and quick.
- it is simple to centre the view on a base map.
Background Images
Background images are limited to those hosted by ESRI online.
Imagery that can be displayed in ArcGIS Pro is not able to be (we can’t figure out how) be displayed as a background image on the mobile device. This prevents recent, high quality imagery such as nearmap from being available in the field.
Spatial misalignments of background imagery from ESRI cannot be corrected.
Potentially imagery is not preserved when Collector is used in online mode when the device screen is turned off. More work is
Background images can be downloaded via cellular network on the fly or you can manually pre-load the area of interest by dragging the screen over the area of interest. This method is very good for linear areas such as under an aircraft flight path. Background imagery persists between sessions.
Background images can also be created in a GIS as an mbtiles file. If the original image is a from a web server such as Open Street Map, then each image level will have a different amount of detail. This is very good for navigation to site. Zoom dependent visibility can also be used in a GIS to show
needed to test this but it seems that the same tiles are downloaded each time they are needed.
If the internet is congested, background imagery will display slowly or a network error will be reported.
It is possible to create tile package files (ptk files) which contain background imagery for Collector, however an add-in is required for ArcMap. These images can then be copied into the device over a USB connection. This capability has not been tried by us.
or hide project layers and this information will be burned into the mbtiles when they are created.
Any imagery that can be displayed in a GIS can be converted to mbtiles. I often use a hillshade blended with an aerial photo.
If the webserver imagery is not located correctly, it is possible to create mbtiles with the imagery shifted to its correct location.
Navigation
North up display
Heads up display or north up display – user selects
Data collection
Both are similar. Both open the keyboard for pick list entries. This is a pain as the keyboard takes up space that could be used to show more picklist entries.
Drawing lines and polygon features in collector is very easy and very refined
Tracks
No tracks by default, although there is a workaround.
Records tracks when track logging is activated. Basis of track point recording can be adjusted in settings
Data management
In online mode, no data management is necessary.
In off-line mode, data has to be synced. Sometimes there are issues with syncing.
Uploaded data is available to most users via Arc Maps Online and to the GIS team via ArcGIS Pro.
Retrieving the data for third party applications requires extra steps such as exporting the data to a folder that is reachable by the applications. The data cannot just be copied out of ArcMaps online. The ability to select rows is disabled. Copying the feature database from the server to a local machine also did
There is some cloud support, but I have not used it. It requires setting up a Postgres Server and some configuration.
I just copy the gpap file from the device and paste it into a folder on my windows PC. A micro USB cable is required for the physical connection.
Prior to copying the gpap file, I may choose to export the photos and gps tracks, which are stored within the gpap database.
Managing this data requires some procedures and an organised filing system but the data can be opened and processed by any suitable application.
not make the data available. The database claims to be empty on local machine but has data on the source machine.
Viewing form data
Form data can be viewed by clicking on points on the map in the field or by clicking on points displayed in ArcOnline. A mini- web page is opened showing the collected information.
Data is collected in JSON format, with the JSON form specification also saved in each record. It is a bit like pdf forms, where the data is saved inside the pdf document and has to be extracted later.
This would be a pain if you do not run a system that can do this (gv-SIG) and are not able to write your own.
The great advantage of this approach is that form design can be evolved in the field. Data already collected is totally unaffected.
Extracted data can be converted to a GIS data file such as a shapefile, just added to a database table or rendered as html or kml.
Usability
In Collector, it is easy to press the back button too many times and to quit the project and even the application by accident.
Issues can occur if a data point is right on the edge of the defined project area. It is not-possible/very difficult as Collector resists the edge of the project area being dragged into the centre of the screen. This is an issue if you have to approach the target via areas that are outside the project area.
Symbol size in our projects is very small, usually round dots. If the colours used are similar, it is hard to tell what the colour is. Also if the coloured dot is used on a strongly coloured background, our eyes will colour balance and the perceived colour will shift.
Screens are prone to clutter. If contour lines are used, then seeing the data can be like looking through spiders web.
In Geopaparazzi, accidentally quiting the current project or the application is very unlikely. Quiting has to be deliberate.
Screen position is not limited to the project area.
Symbol size, colour and shape is under user control.
Screen clutter is manageable. Layers that are only used for navigation can be burned into the background layer.
Multi-user/multi-session experience
This is Collectors’ strongest point. When a
Geopaparazzi is not well suited to live
project is synced, data collected or updated by other people becomes visible. For the field operator, responsibility for managing the data ends as soon as the data is synced. If the data fails to sync, and this can happen, then the data is lost (iPads and Collector!).
ArcPro is required to make Collector projects so GIS support is required.
updates in the field as far as I know.
It is possible to create a new project everyday and to import data from that project into a GIS. I have written an application that can append data from incoming gpap files into a master database, however as far as I know, the Geopaparazzi ecosystem otherwise lacks this capability.
Being able to start a new project anywhere at anytime provide great flexibility.