Well, this is what happened to me, since I wanted to make the uDig style editor from the merging of SLD into the QGIS gui design. So I decided, as you probably saw in my latest posts, that there had to be something called rules which would represent a style property for a certain geometry.
In SLD there are things called FeatureTypeStyle and Rule. And later I will show you also what they can infuence.
For now let's start with a simple road-map.
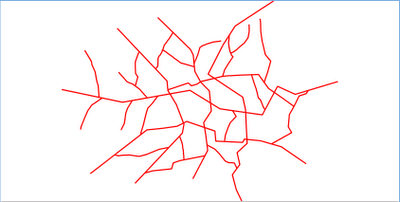
Which in the editor looks like:
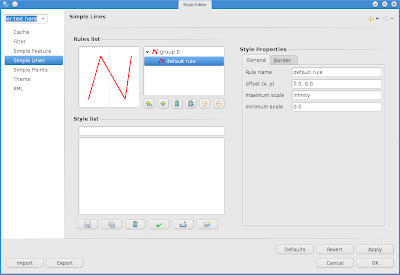
You might note that the rules list if now a tree viewer. Whan looking at the tree viewer think of the following mapping:
root elements = groups = FeatureTypeStyle
children elements = rule = Rule
For some that might sound strange, but I know some will understand :)
Alright, let's add a second rule that has a line a bit thicker then the first, in order to give the feeling of a line with black border.
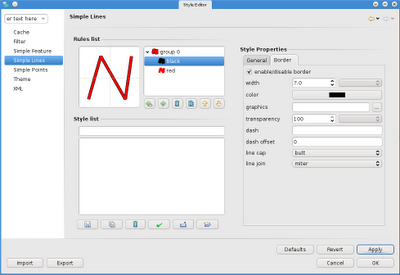
We now have a group with two rules, which will result in:
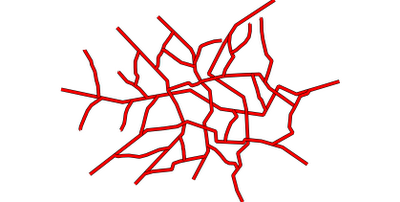
And exactly here lies the problem. Do you see the ugly overlapping of the roads?
If we instead do the same with two groups and one rule per group:
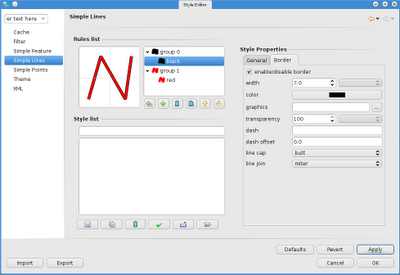
we gain the wanted result:
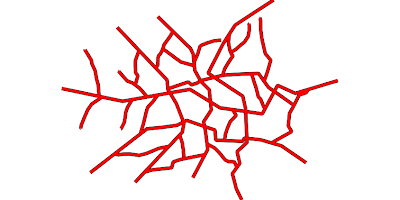
if we then also take care a bit of the caps and joins of the lines it looks even better:
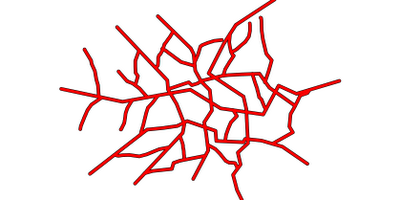
To end the thing with some more fun, let's play with the dashing of the lines.
We first set the dash of the red line to 40.0, 40.0:
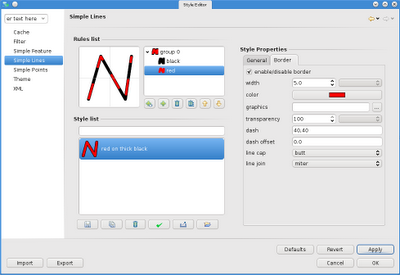
and let's also add some ticks to make it nicer:
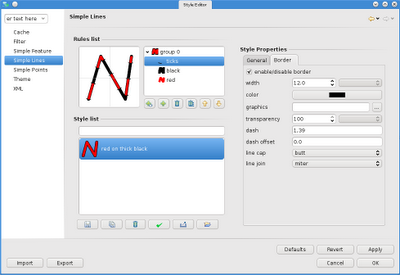
And here we go:
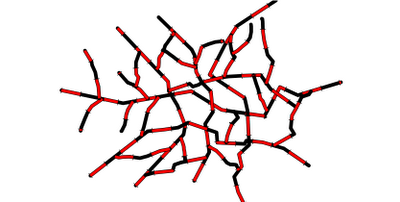
Well, we have again the overlapping problem... so we try to split in more groups:
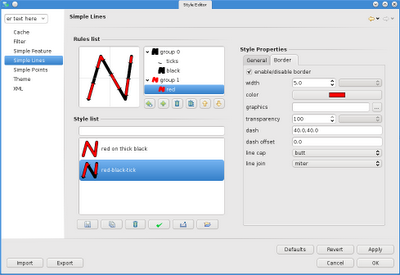
which is better, but we still have problems on the line ends:
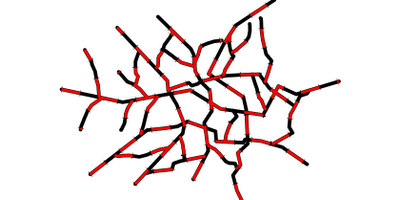
Well, at the end I also did a try with graphics stroke, but that one is not yet well supported in the geotools 2.6 series, which is on what uDig 1.2 bases on:
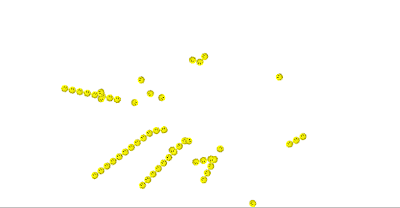
They say geotools 2.7 has better support for graphics strokes, so that will be available in uDig 1.3.
No comments:
Post a Comment