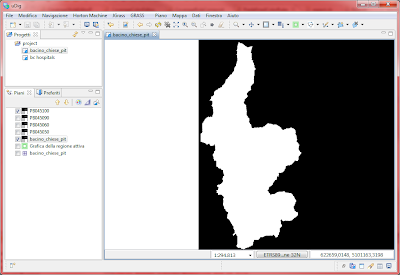
For example if you now load a geotiff that contains novalues into udig, you will get this:
For JGrass maps we always had our own styleing way, but now things will change, since we are porting everything to the coverage engine of uDig.
It is quite obvious that the above map doesn't help that much :)
Luckily we have a customer (that for now has to be hidden) that is paying for better raster styling.
The first tests are already so nice, that I needed to share them.
Well, let's go back to our geotiff.
If I open the style editor, now I am presented the typical JGrass raster styler. Since currently the sld file, if available, is not read, the panel of colorrules will be empty. There is a reset button that helps, by getting the extrema from the map and proposing a greyscale colortable:
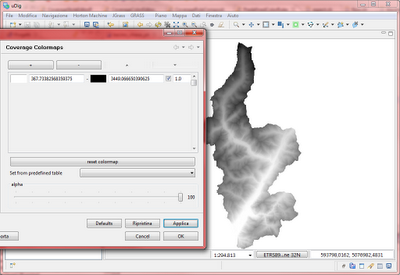
Grayscale is already better than the first result, but I prefer colors...
Ok, there are a bunch of buttons to add rules and define their colors and range values by hand... but we are lazy, so for our lazy friends we made a chombobox of predefined colortables.
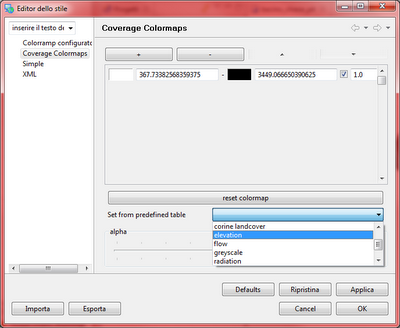
For example by choosing the elevation table, I will get:
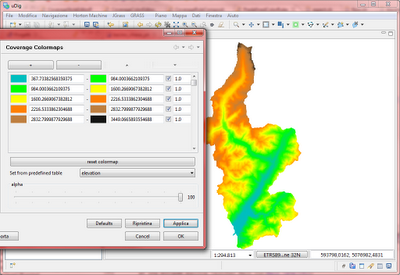
The elevation colormap proposes a set of colorrules, equally interpolated between the extrema of the map. I can also decide to disable some of the rules and engine will ignore them producing:
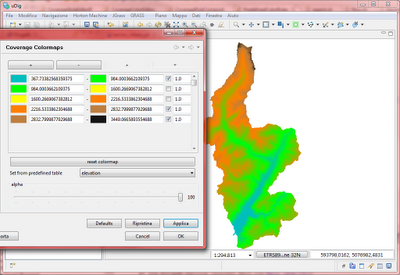
Did you think it would produce a whole? No, it just interpolates between the active rules. But yes, you can produce a whole just by setting the opacity of the rule to some transparency, as for example to 0.5:
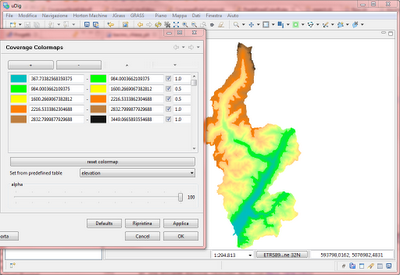
or maybe really to 0.0 to achive the whole?
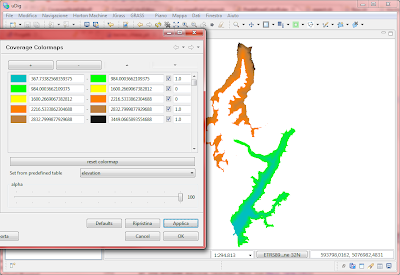
And yes, the slider in the lower part gives general transparency:
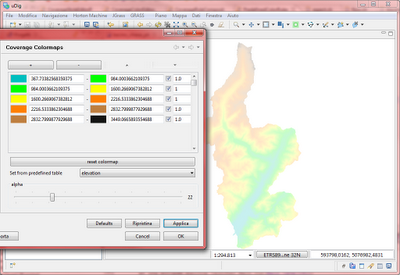
Cool, what else can we do?
Do you use tecnical maps? Not? The ones with all the nice informations in black on white background:

well the greatest thing would be to be able to make the white part transparent, the black part white (or any visible color) and overlay that over an ortophoto.
Ok, so open the styleeditor and push reset to see what values are contained:

Sure, as we expected, it is a bitmap. 1 is something and 0 is something. So let us chose one of the proposed colortables:

Yeah, that now has the blacks part converted to white. To remove the black part, we can just disable the colorrule or make it transparent, remember?
Well, since the maps background is white, I will now propose a red drawing and transparent background:

Easy, right?
This has all been done on one band maps were this kind of colormaps make sense.
I hope to get that soon into uDig, since I have really missed this...
2 comments:
Hi..
Im using udig today..
I tryed to find a plugin like u write above.. I tryed to making colomapp on one band raster file..its a TIFF-file kan u give me tips where i can find the plugin?
Sorry about that, the plugin isn't in udig yet. It is part of the JGrass plugins.
Post a Comment