Thursday, December 24, 2009

Getting smarter... the Xmas query tool

The transition to use coverages at internal level in JGrass, to be more compatible with geotools slowly proves that the hard work done (and ongoing) is worth the price.

One example for this is what was known as the Raster Query Tool which was used to query grass raster layers, as shown in this picture:
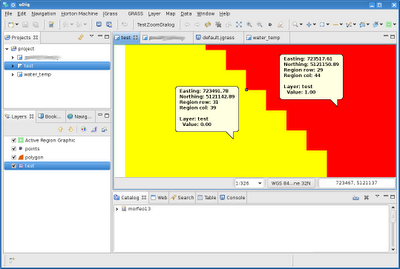


Well, we now decided to make it a bit smarter, such that it would understand the underlying raster layer.

The Smart query tool can now be found here:


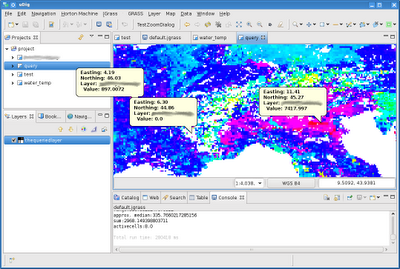
The following image shows a query done on a tiff layer:


But what makes me really happy is the way it is able to query layers that depend on time and depth, as for example a netcdf layer. The result look like this:
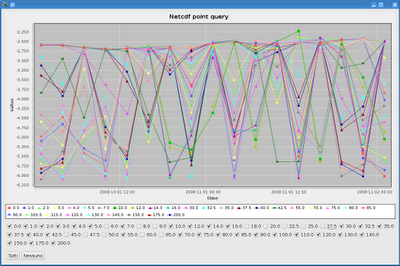


What happens is that the values are shown along the Y axis, while time and depth along the X axis. Well, in the case in which the dataset depends on both, time is shown along the X axis and a chart is created for every depth available. The charts can also be switched on and off for better understanding.

To be even smarter, we enabled the tool to work also on feature layers, by showing the attributes and some additional informations depending on the geometry type (such as number of nodes, centroid, area, etc):


What happens if several layers are selected? Depends on the layer types, anyways, the case of feature and coverage ones is not handled really well, it shows popups in a pile. For sure you get the info you wanted, you just have to browse it :)


So happy Christmas to everyone and a great great new JGrass year!!!!!!
Tuesday, December 8, 2009

Arcmap dbf import to BeeGIS

Recently we did a 3 days uDig-JGrass-BeeGIS course for some very nice guys. When they saw BeeGIS, they were very intereted and one question that came to the surface by one guy owning a handheld with arcmap, was if it would be possible to import the arcpad file into the database of BeeGIS, in order to exploit it to synchronise pictures on the map.

Well, since they really where that nice, we created a small import tool for BeeGIS.
You should know that from arcpad you can export a point shapefile, which has a big attribute table with all the infos in it.
The below is an example:


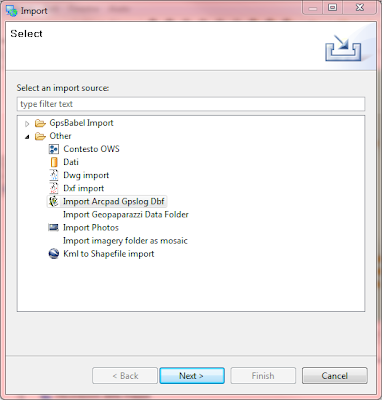
To use it just follow the steps:

1) Go to File -> import and select "Import Arcpad..."


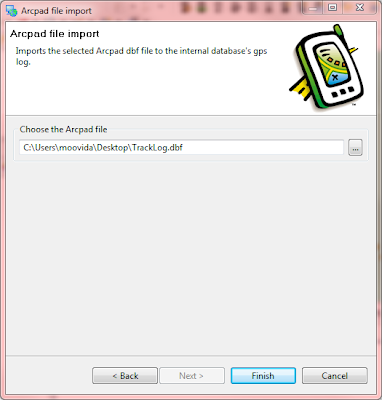
2) In the following tab insert the path to the dbf file exported from Arcpad


After pushing finish the dbf is imported into the database's internal gps log, which is also use for the photo sync.

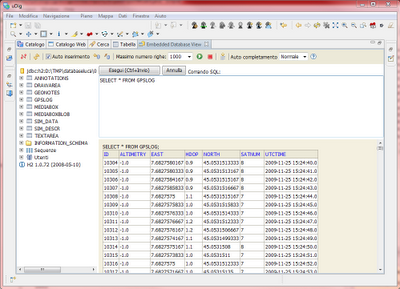
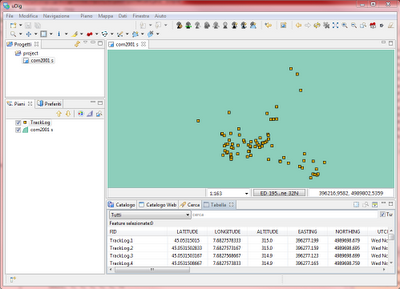
In fact if we have a look into the database view, we can see that the imported data are there:


Guess that will make it into the next build.

Saturday, December 5, 2009

EPL-GPL: Open letter to the FSFEurope

Since I have enough of not knowing exactly how to deal with the
EPL-GPL problem, I am going to write to the FSFEurope for
clarification.

The letter I will send is placed here:
http://jgrass.wiki.software.bz.it/jgrass/Open_letter_to_the_fSFEurope

It will for sure change during the next days, but I plan to send it by
mid of next week.

Constructive comment are welcome!

New BeeGIS version available

It has taken a real long while, but finally a new BeeGIS version is out. It has a lot of enhancements and fixes that would take me too long to explain. One real important thing is that now we have a manual. Also now BeeGIS has not JGrass dependencies and as such can be installed into uDig directly.

For installation instructions have a look here.

You can download the manual here.

Friday, December 4, 2009

Moving a little step closer to OSM

It is a while that I wanted to create some tools to support Openstreetmap in BeeGIS in order to be able to upload digitalized field data to OSM.

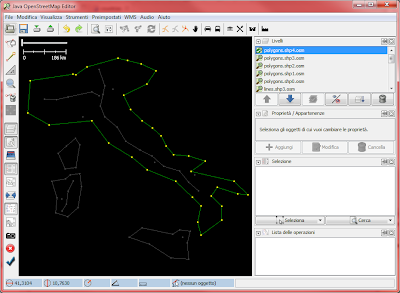
Well, a little step was done now, which is a shapefile to osm exporter. As so often happens I didn't do anything great here, but I used to magnificent powers of open source and borrowed it from Ian Dees shp-to-osm project which luckily is written in java.

How to use it? It is wrapped together with dxf, dwg and kml import in the vector import/export plugin, which can be found here with installation instruction.

The rest is easy.

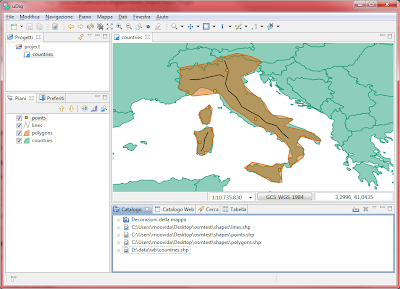
1) assume I have 3 layers of Points, MultiLines and MultiPolygons


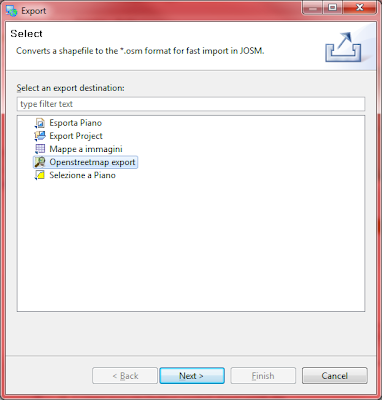
2) File -> export -> Openstreetmap export


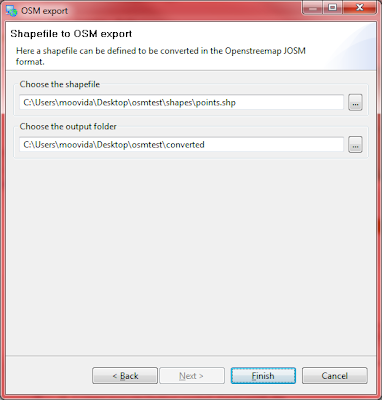
3) Choose the shapefile, and output folder


A bunch of osm files will be created in the output folder.

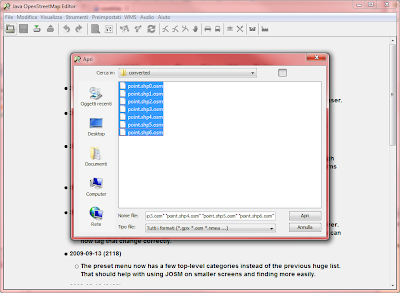
4) Open JOSM and import them


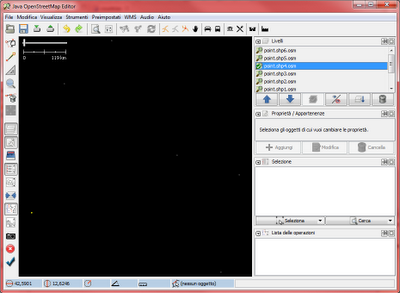
Since they are just points, you won't see that much, right?


But if I do the same with the line and polygon layer and then import all the osm files created, it looks prettier:


Next will be do the export directly from feature layer, which could be backed by any datastore, shapefile, postgis or whatever.

Wednesday, December 2, 2009

Is raster styling finally coming to uDig?

As JGrass gets more and more into uDig, we are starting to need decent styling for rasters that are based on physical data.
For example if you now load a geotiff that contains novalues into udig, you will get this:


For JGrass maps we always had our own styleing way, but now things will change, since we are porting everything to the coverage engine of uDig.
It is quite obvious that the above map doesn't help that much :)

Luckily we have a customer (that for now has to be hidden) that is paying for better raster styling.

The first tests are already so nice, that I needed to share them.

Well, let's go back to our geotiff.

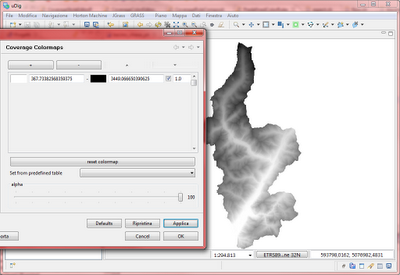
If I open the style editor, now I am presented the typical JGrass raster styler. Since currently the sld file, if available, is not read, the panel of colorrules will be empty. There is a reset button that helps, by getting the extrema from the map and proposing a greyscale colortable:


Grayscale is already better than the first result, but I prefer colors...
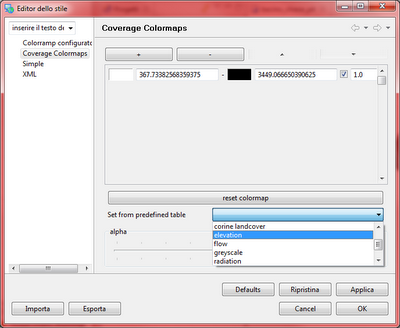
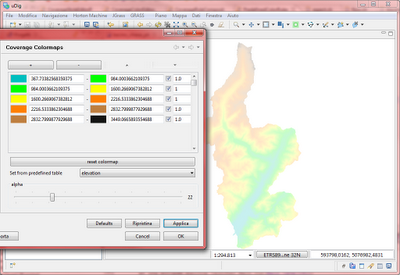
Ok, there are a bunch of buttons to add rules and define their colors and range values by hand... but we are lazy, so for our lazy friends we made a chombobox of predefined colortables.


For example by choosing the elevation table, I will get:


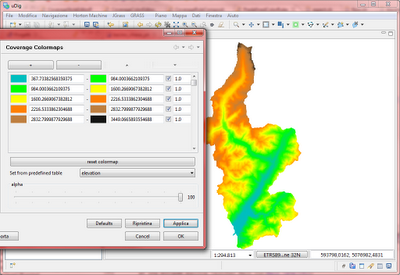
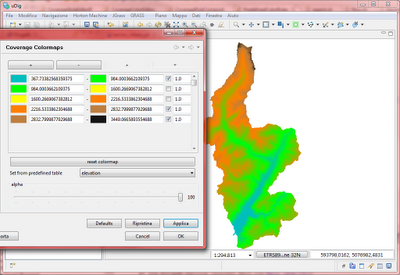
The elevation colormap proposes a set of colorrules, equally interpolated between the extrema of the map. I can also decide to disable some of the rules and engine will ignore them producing:


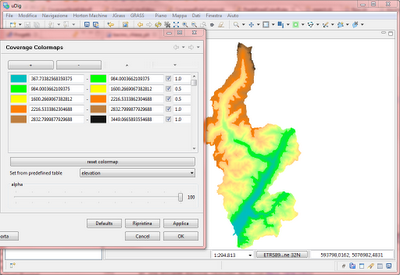
Did you think it would produce a whole? No, it just interpolates between the active rules. But yes, you can produce a whole just by setting the opacity of the rule to some transparency, as for example to 0.5:


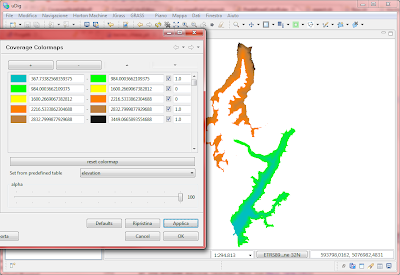
or maybe really to 0.0 to achive the whole?


And yes, the slider in the lower part gives general transparency:


Cool, what else can we do?
Do you use tecnical maps? Not? The ones with all the nice informations in black on white background:


well the greatest thing would be to be able to make the white part transparent, the black part white (or any visible color) and overlay that over an ortophoto.

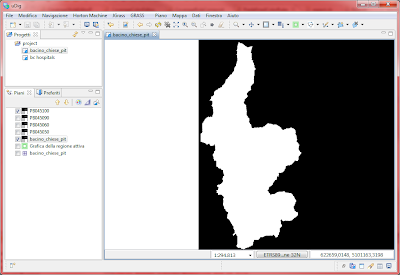
Ok, so open the styleeditor and push reset to see what values are contained:


Sure, as we expected, it is a bitmap. 1 is something and 0 is something. So let us chose one of the proposed colortables:


Yeah, that now has the blacks part converted to white. To remove the black part, we can just disable the colorrule or make it transparent, remember?
Well, since the maps background is white, I will now propose a red drawing and transparent background:


Easy, right?

This has all been done on one band maps were this kind of colormaps make sense.
I hope to get that soon into uDig, since I have really missed this...

Tuesday, December 1, 2009

New CSV import interface

I know I should be writing a wrapup of Foss4G at Sydney and the the week afetr that GFOSS (the Italian local chapter), but coding is definitely more fun... uff

Well, at the last mixed uDig-JGrass-BeeGIS course we gave one recurring thing came out. People still use to have csv files and need to import them into GIS a LOT!!!
For those who do not know, CSV stands for comma separated values and is a text file that looks like:

705305.932992739,5120058.63261393,1119,Caoria
661379.517932081,5119555.28429439,1050,Mezzolombardo
664079.406089368,5144854.34099646,1032,Fondo
...
...

So this morning I decided to add a new interface for that in JGrass. I hope it will be accepted quickly in uDig so that it goes into there.

How does it work now?

1) File -> Import and then choose CSV import


2) Browse for the file to import and choose the separator character/string.


The preview in the lower part helps you to see what is going on and also gives you the possibility to choose a type for the various fields, as well as the name. Remember that an X and an Y are mandatory.


3) Choose the coordinate system and push finish.


Nothing new obviously, but that was definitely missing in the uDig family.